0001754820--12-312020FY26189545261895451387800023675035236750353780600037806000131528961315289644852000448520002107519321075193180353000180353000134507031345070313466700013466700024947372494737249770002467700010003810910003810943653300000000000trueP3Y200000020000000.513878000436533000P1Yfalse0001754820dm:WarrantsIssuedUnderStrategicCollaborationAgreementMemberus-gaap:MeasurementInputRiskFreeInterestRateMember2020-12-310001754820dm:WarrantsIssuedUnderStrategicCollaborationAgreementMemberus-gaap:MeasurementInputOptionVolatilityMember2020-12-310001754820dm:WarrantsIssuedUnderStrategicCollaborationAgreementMemberus-gaap:MeasurementInputExpectedTermMember2020-12-310001754820dm:WarrantsIssuedInExchangeOfTechnicalTechnicalResearchAndDevelopmentAdvisorServicesMemberus-gaap:MeasurementInputRiskFreeInterestRateMember2020-12-310001754820dm:WarrantsIssuedInExchangeOfTechnicalTechnicalResearchAndDevelopmentAdvisorServicesMemberus-gaap:MeasurementInputOptionVolatilityMember2020-12-310001754820dm:WarrantsIssuedInExchangeOfTechnicalTechnicalResearchAndDevelopmentAdvisorServicesMemberus-gaap:MeasurementInputExpectedTermMember2020-12-310001754820srt:MinimumMemberdm:WarrantsIssuedUnderStrategicCollaborationAgreementMemberus-gaap:MeasurementInputExpectedTermMember2019-12-310001754820srt:MaximumMemberdm:WarrantsIssuedUnderStrategicCollaborationAgreementMember2019-12-310001754820dm:WarrantsIssuedUnderStrategicCollaborationAgreementMemberus-gaap:MeasurementInputRiskFreeInterestRateMember2019-12-310001754820dm:WarrantsIssuedUnderStrategicCollaborationAgreementMemberus-gaap:MeasurementInputOptionVolatilityMember2019-12-310001754820us-gaap:SeriesEPreferredStockMemberus-gaap:AdditionalPaidInCapitalMember2019-01-012019-12-310001754820dm:SeriesE1PreferredStockMemberus-gaap:AdditionalPaidInCapitalMember2019-01-012019-12-310001754820srt:CumulativeEffectPeriodOfAdoptionAdjustmentMemberus-gaap:ConvertiblePreferredStockMember2018-12-310001754820us-gaap:ConvertiblePreferredStockMember2018-12-310001754820us-gaap:RestrictedStockMember2015-01-012015-12-310001754820us-gaap:RestrictedStockMemberdm:AddleapAbMember2019-03-012019-03-310001754820us-gaap:RetainedEarningsMember2020-12-310001754820us-gaap:AdditionalPaidInCapitalMember2020-12-310001754820us-gaap:AccumulatedOtherComprehensiveIncomeMember2020-12-310001754820us-gaap:RetainedEarningsMember2019-12-310001754820us-gaap:AdditionalPaidInCapitalMember2019-12-310001754820us-gaap:AccumulatedOtherComprehensiveIncomeMember2019-12-310001754820srt:CumulativeEffectPeriodOfAdoptionAdjustmentMemberus-gaap:AdditionalPaidInCapitalMember2018-12-310001754820srt:CumulativeEffectPeriodOfAdoptionAdjustedBalanceMemberus-gaap:RetainedEarningsMember2018-12-310001754820srt:CumulativeEffectPeriodOfAdoptionAdjustedBalanceMemberus-gaap:ReceivablesFromStockholderMember2018-12-310001754820srt:CumulativeEffectPeriodOfAdoptionAdjustedBalanceMemberus-gaap:AdditionalPaidInCapitalMember2018-12-310001754820srt:CumulativeEffectPeriodOfAdoptionAdjustedBalanceMemberus-gaap:AccumulatedOtherComprehensiveIncomeMember2018-12-310001754820us-gaap:RetainedEarningsMember2018-12-310001754820us-gaap:ReceivablesFromStockholderMember2018-12-310001754820us-gaap:AdditionalPaidInCapitalMember2018-12-310001754820us-gaap:AccumulatedOtherComprehensiveIncomeMember2018-12-310001754820srt:CumulativeEffectPeriodOfAdoptionAdjustmentMember2018-12-310001754820srt:CumulativeEffectPeriodOfAdoptionAdjustedBalanceMember2018-12-310001754820dm:AccruedExpensesAndOtherCurrentLiabilitiesMember2020-12-310001754820dm:AccruedExpensesAndOtherCurrentLiabilitiesMember2019-12-310001754820us-gaap:CommonStockMember2020-12-310001754820dm:MergerWithTrineMember2020-12-080001754820us-gaap:CommonStockMember2019-12-310001754820srt:CumulativeEffectPeriodOfAdoptionAdjustmentMemberus-gaap:CommonStockMember2018-12-310001754820srt:CumulativeEffectPeriodOfAdoptionAdjustedBalanceMemberus-gaap:CommonStockMember2018-12-310001754820us-gaap:CommonStockMember2018-12-310001754820srt:MinimumMemberdm:PublicWarrantsMemberus-gaap:CommonClassAMember2020-12-310001754820srt:MinimumMember2020-12-310001754820dm:WarrantsIssuedUnderStrategicCollaborationAgreementMember2020-12-310001754820dm:WarrantsIssuedInExchangeOfTechnicalTechnicalResearchAndDevelopmentAdvisorServicesMember2020-12-310001754820dm:WarrantsIssuedUnderStrategicCollaborationAgreementMember2019-12-310001754820us-gaap:RestrictedStockMember2015-12-310001754820dm:IncentiveAwardPlan2020Member2020-12-012020-12-310001754820dm:TwoThousandFifteenStockIncentivePlanMember2015-12-310001754820us-gaap:ShareBasedPaymentArrangementEmployeeMember2019-12-310001754820dm:ConsultantMember2019-12-310001754820us-gaap:RestrictedStockMember2020-01-012020-12-310001754820us-gaap:RestrictedStockMember2020-12-310001754820us-gaap:RestrictedStockMember2019-12-310001754820us-gaap:RestrictedStockUnitsRSUMemberdm:EnvisiontecUsLlcAndAffiliatesMemberus-gaap:SubsequentEventMember2021-02-162021-02-160001754820us-gaap:RestrictedStockMember2019-01-012019-12-310001754820dm:TwoThousandFifteenStockIncentivePlanMember2015-01-012015-12-310001754820dm:RestrictedCashMember2020-12-310001754820us-gaap:ServiceMemberus-gaap:EMEAMember2020-01-012020-12-310001754820us-gaap:ServiceMembersrt:AsiaPacificMember2020-01-012020-12-310001754820us-gaap:ServiceMembersrt:AmericasMember2020-01-012020-12-310001754820us-gaap:ProductMemberus-gaap:EMEAMember2020-01-012020-12-310001754820us-gaap:ProductMembersrt:AsiaPacificMember2020-01-012020-12-310001754820us-gaap:ProductMembersrt:AmericasMember2020-01-012020-12-310001754820us-gaap:TransferredOverTimeMember2020-01-012020-12-310001754820us-gaap:TransferredAtPointInTimeMember2020-01-012020-12-310001754820us-gaap:EMEAMember2020-01-012020-12-310001754820srt:AsiaPacificMember2020-01-012020-12-310001754820srt:AmericasMember2020-01-012020-12-310001754820us-gaap:ServiceMemberus-gaap:EMEAMember2019-01-012019-12-310001754820us-gaap:ServiceMembersrt:AsiaPacificMember2019-01-012019-12-310001754820us-gaap:ServiceMembersrt:AmericasMember2019-01-012019-12-310001754820us-gaap:ProductMemberus-gaap:EMEAMember2019-01-012019-12-310001754820us-gaap:ProductMembersrt:AsiaPacificMember2019-01-012019-12-310001754820us-gaap:ProductMembersrt:AmericasMember2019-01-012019-12-310001754820us-gaap:TransferredOverTimeMember2019-01-012019-12-310001754820us-gaap:TransferredAtPointInTimeMember2019-01-012019-12-310001754820us-gaap:EMEAMember2019-01-012019-12-310001754820srt:AsiaPacificMember2019-01-012019-12-310001754820srt:AmericasMember2019-01-012019-12-310001754820srt:MinimumMemberus-gaap:EquipmentMember2020-01-012020-12-310001754820srt:MaximumMemberus-gaap:EquipmentMember2020-01-012020-12-310001754820us-gaap:ToolsDiesAndMoldsMember2020-01-012020-12-310001754820us-gaap:SoftwareDevelopmentMember2020-01-012020-12-310001754820us-gaap:FurnitureAndFixturesMember2020-01-012020-12-310001754820us-gaap:ComputerEquipmentMember2020-01-012020-12-310001754820us-gaap:ToolsDiesAndMoldsMember2020-12-310001754820us-gaap:SoftwareDevelopmentMember2020-12-310001754820us-gaap:LeaseholdImprovementsMember2020-12-310001754820us-gaap:FurnitureAndFixturesMember2020-12-310001754820us-gaap:EquipmentMember2020-12-310001754820us-gaap:ConstructionInProgressMember2020-12-310001754820us-gaap:ComputerEquipmentMember2020-12-310001754820us-gaap:ToolsDiesAndMoldsMember2019-12-310001754820us-gaap:SoftwareDevelopmentMember2019-12-310001754820us-gaap:LeaseholdImprovementsMember2019-12-310001754820us-gaap:FurnitureAndFixturesMember2019-12-310001754820us-gaap:EquipmentMember2019-12-310001754820us-gaap:ConstructionInProgressMember2019-12-310001754820us-gaap:ComputerEquipmentMember2019-12-310001754820dm:PaycheckProtectionProgramMember2020-04-012020-04-300001754820us-gaap:PreferredStockMember2020-12-310001754820dm:EnvisiontecUsLlcAndAffiliatesMemberus-gaap:SubsequentEventMember2021-02-162021-02-160001754820dm:AddleapAbMember2019-03-012019-03-310001754820us-gaap:SeriesEPreferredStockMember2019-01-012019-12-310001754820dm:SeriesE1PreferredStockMember2019-01-012019-12-310001754820us-gaap:AccumulatedOtherComprehensiveIncomeMember2020-01-012020-12-310001754820us-gaap:AccumulatedOtherComprehensiveIncomeMember2019-01-012019-12-310001754820us-gaap:StateAndLocalJurisdictionMember2020-12-310001754820us-gaap:DomesticCountryMember2020-12-310001754820us-gaap:StateAndLocalJurisdictionMember2019-12-310001754820us-gaap:DomesticCountryMember2019-12-310001754820us-gaap:RetainedEarningsMember2020-01-012020-12-310001754820us-gaap:RetainedEarningsMember2019-01-012019-12-310001754820dm:FigurMachineToolsLlcMember2020-12-310001754820us-gaap:TechnologyBasedIntangibleAssetsMember2020-12-310001754820us-gaap:FairValueInputsLevel3Member2020-12-310001754820us-gaap:FairValueInputsLevel3Member2020-01-012020-12-310001754820us-gaap:RestrictedStockUnitsRSUMember2020-12-3100017548202020-07-012020-07-310001754820dm:PropertyPlantAndEquipmentOtherThanAcquiredTechnologyOrCapitalizedSoftwareMember2020-01-012020-12-310001754820dm:PropertyPlantAndEquipmentOtherThanAcquiredTechnologyOrCapitalizedSoftwareMember2019-01-012019-12-310001754820dm:TermLoanMemberus-gaap:PrimeRateMember2020-12-310001754820dm:TermLoanMemberus-gaap:PrimeRateMember2019-12-310001754820dm:TermLoanMemberus-gaap:PrimeRateMember2020-01-012020-12-310001754820dm:TermLoanMemberus-gaap:PrimeRateMember2019-01-012019-12-310001754820dm:PublicWarrantsMember2020-02-242020-02-240001754820us-gaap:SubsequentEventMember2021-02-262021-02-260001754820us-gaap:ServiceMember2020-01-012020-12-310001754820us-gaap:ProductMember2020-01-012020-12-310001754820us-gaap:ServiceMember2019-01-012019-12-310001754820us-gaap:ProductMember2019-01-012019-12-3100017548202018-03-3100017548202018-03-012018-03-3100017548202020-08-200001754820us-gaap:CommonClassAMember2020-12-310001754820dm:IncentiveAwardPlan2020Member2020-12-310001754820dm:PublicWarrantsMemberus-gaap:WarrantMember2020-12-310001754820dm:PublicWarrantsMemberus-gaap:CommonClassAMember2020-12-310001754820dm:PublicWarrantsMember2020-02-240001754820us-gaap:MoneyMarketFundsMember2020-12-310001754820us-gaap:CommercialPaperMember2020-12-310001754820us-gaap:RepurchaseAgreementsMember2019-12-310001754820us-gaap:MoneyMarketFundsMember2019-12-310001754820us-gaap:ComputerSoftwareIntangibleAssetMember2020-01-012020-12-310001754820us-gaap:ComputerSoftwareIntangibleAssetMember2019-01-012019-12-310001754820us-gaap:ComputerSoftwareIntangibleAssetMember2020-12-310001754820us-gaap:ComputerSoftwareIntangibleAssetMember2019-12-310001754820dm:MakeCompositesInc.Member2019-07-310001754820dm:AddleapAbMember2019-03-310001754820dm:ForustCorporationMember2020-10-012020-10-310001754820dm:MakeCompositesInc.Member2019-07-012019-07-310001754820dm:MakeCompositesInc.Memberus-gaap:GeneralAndAdministrativeExpenseMember2019-07-012019-07-310001754820dm:AddleapAbMemberus-gaap:GeneralAndAdministrativeExpenseMember2019-03-012019-03-310001754820dm:MergerWithTrineMemberdm:BusinessCombinationSubscriptionAgreementMember2020-12-090001754820dm:MergerWithTrineMember2020-12-090001754820us-gaap:USGovernmentDebtSecuritiesMember2020-12-310001754820us-gaap:BondsMember2020-12-310001754820us-gaap:USGovernmentDebtSecuritiesMember2019-12-310001754820us-gaap:USTreasurySecuritiesMember2020-12-310001754820us-gaap:BondsMember2019-12-310001754820us-gaap:AssetBackedSecuritiesMember2019-12-310001754820us-gaap:USTreasurySecuritiesMemberus-gaap:FairValueInputsLevel1Memberus-gaap:FairValueMeasurementsRecurringMember2020-12-310001754820us-gaap:OtherInvestmentsMemberus-gaap:FairValueInputsLevel3Memberus-gaap:FairValueMeasurementsRecurringMember2020-12-310001754820us-gaap:MoneyMarketFundsMemberus-gaap:FairValueInputsLevel1Memberus-gaap:FairValueMeasurementsRecurringMember2020-12-310001754820us-gaap:CorporateDebtSecuritiesMemberus-gaap:FairValueInputsLevel2Memberus-gaap:FairValueMeasurementsRecurringMember2020-12-310001754820us-gaap:CommercialPaperMemberus-gaap:FairValueInputsLevel2Memberus-gaap:FairValueMeasurementsRecurringMember2020-12-310001754820us-gaap:USTreasurySecuritiesMemberus-gaap:FairValueMeasurementsRecurringMember2020-12-310001754820us-gaap:OtherInvestmentsMemberus-gaap:FairValueMeasurementsRecurringMember2020-12-310001754820us-gaap:MoneyMarketFundsMemberus-gaap:FairValueMeasurementsRecurringMember2020-12-310001754820us-gaap:FairValueInputsLevel3Memberus-gaap:FairValueMeasurementsRecurringMember2020-12-310001754820us-gaap:FairValueInputsLevel2Memberus-gaap:FairValueMeasurementsRecurringMember2020-12-310001754820us-gaap:FairValueInputsLevel1Memberus-gaap:FairValueMeasurementsRecurringMember2020-12-310001754820us-gaap:CorporateDebtSecuritiesMemberus-gaap:FairValueMeasurementsRecurringMember2020-12-310001754820us-gaap:CommercialPaperMemberus-gaap:FairValueMeasurementsRecurringMember2020-12-310001754820us-gaap:FairValueMeasurementsRecurringMember2020-12-310001754820us-gaap:RepurchaseAgreementsMemberus-gaap:FairValueInputsLevel2Memberus-gaap:FairValueMeasurementsRecurringMember2019-12-310001754820us-gaap:MoneyMarketFundsMemberus-gaap:FairValueInputsLevel1Memberus-gaap:FairValueMeasurementsRecurringMember2019-12-310001754820us-gaap:CorporateDebtSecuritiesMemberus-gaap:FairValueInputsLevel2Memberus-gaap:FairValueMeasurementsRecurringMember2019-12-310001754820us-gaap:CommercialPaperMemberus-gaap:FairValueInputsLevel2Memberus-gaap:FairValueMeasurementsRecurringMember2019-12-310001754820us-gaap:AssetBackedSecuritiesMemberus-gaap:FairValueInputsLevel2Memberus-gaap:FairValueMeasurementsRecurringMember2019-12-310001754820us-gaap:RepurchaseAgreementsMemberus-gaap:FairValueMeasurementsRecurringMember2019-12-310001754820us-gaap:MoneyMarketFundsMemberus-gaap:FairValueMeasurementsRecurringMember2019-12-310001754820us-gaap:FairValueInputsLevel2Memberus-gaap:FairValueMeasurementsRecurringMember2019-12-310001754820us-gaap:FairValueInputsLevel1Memberus-gaap:FairValueMeasurementsRecurringMember2019-12-310001754820us-gaap:CorporateDebtSecuritiesMemberus-gaap:FairValueMeasurementsRecurringMember2019-12-310001754820us-gaap:CommercialPaperMemberus-gaap:FairValueMeasurementsRecurringMember2019-12-310001754820us-gaap:AssetBackedSecuritiesMemberus-gaap:FairValueMeasurementsRecurringMember2019-12-310001754820us-gaap:FairValueMeasurementsRecurringMember2019-12-310001754820us-gaap:WarrantMember2020-01-012020-12-310001754820us-gaap:RestrictedStockUnitsRSUMember2020-01-012020-12-310001754820us-gaap:RestrictedStockMember2020-01-012020-12-310001754820us-gaap:EmployeeStockMember2020-01-012020-12-310001754820dm:UnvestedTrineFounderSharesMember2020-01-012020-12-310001754820us-gaap:WarrantMember2019-01-012019-12-310001754820us-gaap:RestrictedStockUnitsRSUMember2019-01-012019-12-310001754820us-gaap:EmployeeStockMember2019-01-012019-12-310001754820us-gaap:TechnologyBasedIntangibleAssetsMember2019-01-012019-12-3100017548202020-09-282020-09-280001754820us-gaap:ResearchAndDevelopmentExpenseMember2020-01-012020-12-310001754820us-gaap:GeneralAndAdministrativeExpenseMember2020-01-012020-12-310001754820us-gaap:CostOfSalesMember2020-01-012020-12-310001754820us-gaap:ResearchAndDevelopmentExpenseMember2019-01-012019-12-310001754820us-gaap:GeneralAndAdministrativeExpenseMember2019-01-012019-12-310001754820us-gaap:CostOfSalesMember2019-01-012019-12-310001754820us-gaap:SellingAndMarketingExpenseMember2020-01-012020-12-310001754820us-gaap:SellingAndMarketingExpenseMember2019-01-012019-12-310001754820us-gaap:TechnologyBasedIntangibleAssetsMember2020-01-012020-12-310001754820us-gaap:PrivatePlacementMemberus-gaap:SubsequentEventMember2021-01-012021-03-100001754820us-gaap:WarrantMemberus-gaap:SubsequentEventMember2021-02-262021-02-260001754820dm:PublicWarrantsMember2020-12-310001754820dm:DesktopMetalPrivatePlacementWarrantsMember2020-12-310001754820dm:PublicWarrantsMember2020-01-012020-12-310001754820dm:SeriesLegacyPreferredStockMember2020-01-012020-12-310001754820dm:SeriesELegacyPreferredStockMember2020-01-012020-12-310001754820dm:SeriesE1LegacyPreferredStockMember2020-01-012020-12-310001754820dm:SeriesDLegacyPreferredStockMember2020-01-012020-12-310001754820dm:SeriesCLegacyPreferredStockMember2020-01-012020-12-310001754820dm:SeriesBLegacyPreferredStockMember2020-01-012020-12-310001754820dm:SeriesE1LegacyPreferredStockMember2020-12-310001754820dm:SeriesDLegacyPreferredStockMember2020-12-310001754820us-gaap:SeriesEPreferredStockMemberus-gaap:CommonStockMember2019-01-012019-12-310001754820dm:SeriesE1PreferredStockMemberus-gaap:CommonStockMember2019-01-012019-12-310001754820us-gaap:ReceivablesFromStockholderMember2019-01-012019-12-310001754820us-gaap:AdditionalPaidInCapitalMember2019-01-012019-12-310001754820us-gaap:CommonStockMember2019-01-012019-12-310001754820us-gaap:CommonStockMember2020-01-012020-12-310001754820dm:MergerWithTrineMemberdm:BusinessCombinationSubscriptionAgreementMember2020-12-092020-12-090001754820us-gaap:ShareBasedPaymentArrangementEmployeeMember2019-01-012019-12-310001754820dm:ConsultantMember2019-01-012019-12-310001754820us-gaap:ShareBasedPaymentArrangementEmployeeMember2020-01-012020-12-310001754820dm:ConsultantMember2020-01-012020-12-310001754820us-gaap:AdditionalPaidInCapitalMember2020-01-012020-12-3100017548202018-12-3100017548202020-12-090001754820dm:EquityIncentivePlanOfMakeCompositesIncMember2018-01-012018-12-3100017548202020-07-310001754820dm:SeriesLegacyPreferredStockMember2020-12-310001754820dm:SeriesELegacyPreferredStockMember2020-12-310001754820dm:SeriesCLegacyPreferredStockMember2020-12-310001754820dm:SeriesBLegacyPreferredStockMember2020-12-3100017548202020-12-092020-12-090001754820dm:MergerWithTrineMember2020-12-310001754820us-gaap:ShareBasedCompensationAwardTrancheTwoMember2020-12-092020-12-090001754820us-gaap:ShareBasedCompensationAwardTrancheOneMember2020-12-092020-12-090001754820dm:MergerWithTrineMember2020-01-012020-12-3100017548202020-02-240001754820dm:TermLoanMember2018-06-012018-06-300001754820dm:TermLoanMember2018-06-300001754820dm:WarrantsIssuedUnderStrategicCollaborationAgreementMember2020-01-012020-12-310001754820dm:WarrantsIssuedInExchangeOfTechnicalTechnicalResearchAndDevelopmentAdvisorServicesMember2020-01-012020-12-3100017548202019-01-012019-12-310001754820us-gaap:RestrictedStockUnitsRSUMember2020-01-012020-12-3100017548202017-05-3100017548202020-08-310001754820dm:MergerWithTrineMember2020-12-092020-12-090001754820dm:ForustCorporationMember2020-10-012020-10-310001754820dm:FigurMachineToolsLlcMember2020-12-012020-12-310001754820dm:ForustCorporationMember2020-10-3100017548202020-12-3100017548202019-12-310001754820us-gaap:CommonStockMember2020-01-012020-12-310001754820dm:Debentures6.55Due2030Member2020-01-012020-12-3100017548202020-06-3000017548202021-03-1000017548202020-01-012020-12-31dm:Yxbrli:sharesiso4217:USDiso4217:USDxbrli:sharesdm:itemxbrli:puredm:Ddm:directordm:employeedm:agreement

Table of Contents

UNITED STATES

SECURITIES AND EXCHANGE COMMISSION

WASHINGTON, D.C. 20549

FORM 10-K

ANNUAL REPORT PURSUANT TO SECTION 13 OR 15(d) OF THE SECURITIES EXCHANGE ACT OF 1934

For the fiscal year ended December 31, 2020

OR

TRANSITION REPORT PURSUANT TO SECTION 13 OR 15(d) OF THE SECURITIES EXCHANGE ACT OF 1934

Commission file number: 001-38835

DESKTOP METAL, INC.

(Exact name of registrant as specified in its charter)

Delaware

83-2044042

(State of Other Jurisdiction of incorporation or Organization)

(I.R.S. Employer Identification No.)

63 3rd Avenue, Burlington, MA

01803

(Address of principal executive offices)

(Zip code)

Registrant’s telephone number, including area code: (978) 224-1244

Securities registered pursuant to Section 12(b) of the Act:

Name Of Each Exchange

Title of Each Class

Trading Symbol(s)

On Which Registered

Common Stock, $0.001 Par Value per Share
Warrants to purchase common stock

DM
DM.WS

New York Stock Exchange

Securities registered pursuant to Section 12(g) of the Act: None

Indicate by check mark if the registrant is a well-known seasoned issuer, as defined in Rule 405 of the Securities Act.

Yes No

Indicate by check mark if the registrant is not required to file reports pursuant to Section 13 or Section 15(d) of the Act.

Yes No

Indicate by check mark whether the registrant: (1) has filed all reports required to be filed by Section 13 or 15(d) of the Securities Exchange Act of 1934 during the preceding 12 months (or for such shorter period that the registrant was required to file such reports), and (2) has been subject to such filing requirements for the past 90 days.

Yes No

Indicate by check mark whether the Registrant has submitted electronically; every Interactive Data File required to be submitted pursuant to Rule 405 of Regulation S-T (§232.0405 of this chapter) during the preceding 12 months (or for such shorter period that the registrant was required to submit such files).   Yes No

Indicate by check mark whether the registrant is a large accelerated filer, an accelerated filer, a non-accelerated filer, a smaller reporting company, or an emerging growth company. See the definitions of “large accelerated filer,” “accelerated filer,” “smaller reporting company,” and “emerging growth company” in Rule 12b-2 of the Exchange Act.

Large accelerated filer ☐

Accelerated filer ☐

Non-accelerated filer 

Smaller reporting company 

Emerging growth company 

If an emerging growth company, indicate by check mark if the registrant has elected not to use the extended transition period for complying with any new or revised financial accounting standards provided pursuant to Section 13(a) of the Exchange Act.

Indicate by check mark whether the registrant has filed a report on and attestation to its management’s assessment of the effectiveness of its internal control over financial reporting under Section 404(b) of the Sarbanes-Oxley Act (15 U.S.C. 7262(b)) by the registered public accounting firm that prepared or issued its audit report.

Indicate by check mark whether the registrant is a shell company (as defined in Rule 12b-2 of the Exchange Act). Yes No

Based on the closing price as reported on the New York Stock Exchange, the aggregate market value of the Registrant’s Common Stock held by non-affiliates on June 30, 2020 (the last business day of the Registrant’s most recently completed second fiscal quarter) was approximately $95.05 million. Shares of Common Stock held by each executive officer and director and by each shareholder affiliated with a director or an executive officer have been excluded from this calculation because such persons may be deemed to be affiliates. This determination of affiliate status is not necessarily a conclusive determination for other purposes. The number of outstanding shares of the Registrant’s Common Stock as of March 10, 2021 was 244,448,748.

Documents Incorporated by Reference

Portions of the Registrant’s Definitive Proxy Statement relating to the 2021 Annual Meeting of Stockholders to be filed pursuant to Regulation 14A with the Securities Exchange Commission are incorporated by reference into Part III of this report. Such proxy statement will be filed with the Securities and Exchange Commission not later than 120 days following the end of the Registrant’s fiscal year ended December 31, 2020.

Table of Contents

TABLE OF CONTENTS


Page

PART I

Item 1. Business

3

Item 1A. Risk Factors

16

Item 1B. Unresolved Staff Comments

42

Item 2. Properties

42

Item 3. Legal Proceedings

42

Item 4. Mine Safety Disclosures

42

PART II

Item 5. Market for Registrant’s Common Equity, Related Stockholder Matters and Issuer Purchases of Equity Securities

43

Item 6. Selected Financial Data

43

Item 7. Management’s Discussion and Analysis of Financial Condition and Results of Operations

44

Item 7A. Quantitative and Qualitative Disclosures About Market Risk

56

Item 8. Financial Statements and Supplementary Data

56

Item 9. Changes in and Disagreements with Accountants on Accounting and Financial Disclosure

56

Item 9A. Controls and Procedures

57

Item 9B. Other Information

58

PART III

Item 10. Directors, Executive Officers and Corporate Governance

58

Item 11. Executive Compensation

58

Item 12. Security Ownership of Certain Beneficial Owners and Management and Related Stockholder Matters

58

Item 13. Certain Relationships and Related Transactions, and Director Independence

58

Item 14. Principal Accounting Fees and Services

58

PART IV

Item 15. Exhibits and Financial Statement Schedules

59

Item 16. Form 10 K Summary

59

2

Table of Contents

BASIS OF PRESENTATION

On December 9, 2020, we consummated the business combination, or the Business Combination, contemplated by the Agreement and Plan of Merger, dated August 26, 2020, by and among our company (formerly known as Trine Acquisition Corp.), Desktop Metal Operating, Inc. (formerly known as Desktop Metal, Inc.) and Sparrow Merger Sub, Inc., pursuant to which Sparrow Merger Sub, Inc. merged with and into Desktop Metal Operating, Inc., with Desktop Metal Operating, Inc. becoming our wholly owned subsidiary. Upon the closing of the Business Combination, we changed our name to Desktop Metal, Inc.

Unless otherwise indicated or the context otherwise requires, references in this Annual Report on Form 10-K to “we,” “us,” “the company” and “Desktop Metal” refer to the consolidated operations of Desktop Metal, Inc. and its subsidiaries. References to “Trine” refer to the company prior to the consummation of the Business Combination and references to “Legacy Desktop Metal” refer to Desktop Metal Operating, Inc. prior to the consummation of the Business Combination.

CAUTIONARY NOTE REGARDING FORWARD-LOOKING STATEMENTS

This Annual Report on Form 10-K, including "Management’s Discussion and Analysis of Financial Condition and Results of Operations" in Item 7, contains forward-looking statements. All statements contained in this Annual Report on Form 10-K other than statements of historical fact, including statements regarding our future operating results and financial position, our business strategy and plans, market growth, trends, events, and our objectives for future operations, are forward-looking statements. The words “may,” “will,” “expect,” “anticipate,” “believe,” “intend,” “project,” “could,” “would,” “estimate,” “potential,” “continue,” “plan,” “target,” or the negative of these words or similar expressions are intended to identify forward-looking statements.

The forward-looking statements included herein are based on current expectations of management. Actual results may differ from those expressed in forward-looking statements due to additional factors, including those set forth in Part I, Item 1A. “Risk Factors” elsewhere in this Annual Report on Form 10-K. Although we believe that expectations reflected in the forward-looking statements are reasonable, we cannot guarantee future results, performance, or achievements. The events and circumstances reflected in our forward-looking statements may not be achieved or occur, and actual results could differ materially from those projected in the forward-looking statements. Moreover, we operate in an evolving environment. New risk factors and uncertainties may emerge from time to time, and it is not possible for management to predict all risk factors and uncertainties. As a result of these factors, we cannot assure you that the forward-looking statements in this Annual Report on Form 10-K will prove to be accurate. Except as required by applicable law, we do not plan to publicly update or revise any forward-looking statements contained herein, whether as a result of any new information, future events, changed circumstances, or otherwise.

You should read this Annual Report on Form 10-K completely and with the understanding that our actual future results may be materially different from what we expect. We qualify all of our forward-looking statements by these cautionary statements.

PART I

Item 1. Business

Company Overview

Desktop Metal is pioneering a new generation of additive manufacturing technologies focused on the production of end use parts. We offer a portfolio of integrated additive manufacturing solutions for engineers, designers and manufacturers comprised of hardware, software, materials and services. Our solutions span use cases across the product life cycle, from product development to mass production and aftermarket operations, and they address an array of industries, including automotive, aerospace, healthcare, consumer products, heavy industry, machine design and research and development.

At Desktop Metal, we believe additive manufacturing, commonly referred to as 3D printing, is one of the most exciting and transformational technology innovations of our time. According to the Wohlers Report 2020 and management estimates, the global additive manufacturing market, which includes spending on systems, materials, parts and other 3D printing software and services, is expected to grow from $12 billion in 2019 to $146 billion in 2030 at a compound annual growth rate of approximately 25%. Additive manufacturing has the capacity to change the way parts of nearly all materials are designed, manufactured and sold around the world, and it provides businesses of all sizes the means to make high performance products faster, more sustainably, and at costs and volumes

3

Table of Contents

competitive with conventional manufacturing processes. Our mission is to make additive manufacturing accessible to all engineers, designers and manufacturers. In doing so, we believe we will empower businesses to adopt radical, new approaches to design and production and enable the success of many of the high growth industries that will drive global economic growth in the years to come.

Our growth strategy begins with a commitment to research and development. Since our founding in 2015, we have invested significant resources in research and development, including $43.1 million in 2020, towards building an extensive portfolio of proprietary and differentiated technologies with a focus on making additive manufacturing an easy-to-use, economic and scalable solution. Our additive manufacturing platforms, which incorporate these technologies, offer several key advantages over competitive additive manufacturing technologies and provide our customers with several price points depending on their desired features and applications. Our announced additive manufacturing platforms are as follows:

Production System is an industrial manufacturing platform powered by our proprietary Single Pass Jetting, or SPJ, technology, which is designed to achieve speeds up to 100 times those of legacy Powder Bed Fusion, or PBF additive manufacturing technologies and enable production quantities of up to millions of parts per year at part costs competitive with conventional mass production techniques. The Production System platform consists of two printer models. The P-1, which began commercial shipments in the fourth quarter of 2020, is a small form factor solution for process development and serial production applications. The P-50, which is scheduled to begin commercial shipments in 2021, is a large form factor mass production solution for end-use parts.

Shop System is an affordable, turnkey binder jetting platform designed to bring metal 3D printing to machine and job shops, leveraging build rates up to 10 times those of legacy PBF additive manufacturing technologies in combination with our proprietary sintering technology to enable serial production of dense metal parts with exceptional surface finish and rich feature detail. Shop System began commercial shipments in the fourth quarter of 2020.

Studio System is designed for office-friendly metal 3D printing and leverages our proprietary Bound Metal Deposition, or BMD, technology to minimize requirements for special facilities as compared to legacy PBF additive manufacturing technologies and simplify the production of low volumes of complex, high quality metal parts in-house. Studio System has been shipping commercially since the fourth quarter of 2018. In February 2021, we announced a second-generation of the platform, Studio System 2, which further streamlines the BMD process and began commercial shipments in the first quarter of 2021.

Fiber is a desktop 3D printer that incorporates our proprietary Micro Automated Fiber Placement, or AFP technology and is designed to produce high-resolution composite parts reinforced with aerospace- and industrial-grade continuous fiber tape, unlocking superior part strength with high-performance materials starting at an affordable annual subscription price. Fiber began initial commercial shipments in the fourth quarter of 2020.

Software is a critical component of our additive manufacturing solutions and is at the core of their accessibility and ease-of-use. Built on cloud, desktop and mobile technologies, our build preparation software, Fabricate, streamlines the process of setting up prints and works alongside touchscreen controls onboard our products to provide a cohesive, modern user interface and experience across our product portfolio. We also sell an array of consumables, including composite, metal and ceramic materials, which are engineered for use with several of our additive manufacturing products. The sales of these materials provide us with a recurring revenue stream from customers of our additive manufacturing solutions.

At our core, we are a tech company. Our strengths are in technology innovation and product development. Because of this focus and our goal to reach a broad audience, we market and sell our additive manufacturing solutions through a leading global distribution network, managed and augmented by our own internal sales and marketing teams. This distribution network covers over 60 countries around the world and is composed of sales and distribution professionals with decades of experience in digital manufacturing technologies. Similarly, we leverage third-party contract manufacturers to scale up initial prototypes for commercialization and volume commercial shipments. Our internal manufacturing and supply chain teams work collaboratively with both our internal engineering department and these third-party contract manufacturers to scale up initial prototypes for commercialization and volume commercial shipments. Together, our distribution network and manufacturing approach allow us to produce, sell and service our products at-scale in global markets and creates substantial operating leverage as we execute our strategy.

4

Table of Contents

We are led by visionary technologists and a team of proven leaders with experience bringing emerging technologies to market across the hardware, materials and software sectors. Our technologies have the potential to empower engineers and designers to easily access additive manufacturing and drive new application discovery as well as provide manufacturers with reliable and high-performance solutions that facilitate the production of innovative designs in high volumes. We believe that, taken together, these core competencies will propel us towards helping businesses realize the true promise of additive manufacturing.

Industry Background

Conventional manufacturing processes have numerous shortcomings.

Historically, processes such as casting, stamping, molding and machining have dominated global manufacturing, which is a $12 trillion industry, according to estimates by A.T. Kearney. These conventional and subtractive manufacturing techniques have numerous limitations. Most require high upfront expenses in the form of tools, such as molds, dies, jigs or fixtures. Designing and manufacturing these tools can result in long lead times for parts as well as minimum volume requirements in order to achieve cost efficiencies. Tooling requirements associated with casting, stamping, and molding also leave little room for design iteration without increasing time-to-market and development costs. New parts and design changes often require a new mold, thereby slowing the pace at which businesses can introduce new products and react to shifts in market preferences and making it difficult to compete effectively. Computer numerical controlled machining, or CNC machining, is an alternative to stamping, casting and molding that does not require a mold or die, enabling lower-volume production with reduced lead times. However, because CNC machining is a subtractive process in which material is removed from a solid block to create a part, it typically results in higher part costs and significant material waste. In addition, the CNC machining process often requires heavy involvement from specialist technicians, and machine programming can be time intensive. Each of these conventional manufacturing processes also creates design restrictions that can result in significantly higher part weights and costs or require assemblies, adversely impacting performance in favor of manufacturability and driving additional manufacturing and supply chain complexity.

Additive manufacturing has the potential to address the limitations of conventional manufacturing.

Additive manufacturing addresses many of the limitations of conventional manufacturing through a combination of flexibility, ease of use and cost, making it an efficient and effective process across the product life cycle, from design and prototyping to production. Additive manufacturing is a digital manufacturing process that produces 3D objects from digital models through the repeated deposition of thin layers of material. This process eliminates the need for tooling inputs and provides a range of benefits including:

Accelerated time-to-market. Businesses can manufacture design files at the push of a button with no tooling required. While design cycles for conventional manufacturing can take weeks or months, additive manufacturing can shorten this cycle to days due to the ability to rapidly switch between or iterate on designs without excessive delay. Such improvements in time-to-market for new products can help businesses react more rapidly to shifts in customer demand.

Design flexibility. Conventional manufacturing can force design comprises as a result of subtractive manufacturing processes or the use of tools. While 3D printing may involve design guidelines primarily to reduce dependency on supports and optimize process success, designers generally have freedom to produce geometries not possible or economically feasible with conventional manufacturing. As an example, with additive manufacturing, designers can produce intricate organic or complex, lattice shapes that are optimized for strength and functional performance to reduce weight and material usage.

Assembly consolidation. Improved design flexibility enables the consolidation of sub-assemblies into single parts, which can improve reliability by reducing the number of failure points in a product. Decreasing part quantity is also a productivity breakthrough for many businesses. With fewer unique parts to fabricate, procure, store and assemble, businesses can drastically simplify their supply chains.

Mass customization. Additive manufacturing enables the customization and production of designs at scale, eliminating costs traditionally associated with multiple tools and tooling changeover as well as reducing the risk of excess inventory and material obsolescence. Each part printed using additive manufacturing can be identical to or radically different from the other parts within a given print. Several end markets, including audiology and dental, have already leveraged mass customization through additive manufacturing to improve the aesthetics and performance of parts.

5

Table of Contents

Supply chain re-engineering. Additive manufacturing suitable for end-use parts production can improve supply chains by enabling on-demand manufacturing in distributed locations. Decentralized networks of additive manufacturing systems with low tooling and set-up costs can replace centralized facilities with conventional manufacturing equipment. In addition, producing parts near the point and time of demand can significantly reduce lead times, inventories, and dependencies on forecasting without incurring additional costs related to logistics and customs.

Sustainable manufacturing. Additive manufacturing is a more efficient production process than subtractive techniques, such as CNC machining. It requires fewer material inputs and reduces material waste. By enabling optimized geometries lighter than conventionally manufactured counterparts, additive manufacturing can also lead to downstream sustainability benefits, including reduced fuel consumption in industries such as automotive and aerospace. In addition, by reducing supply chain complexity, additive manufacturing can reduce emissions from transporting physical goods around the world.

Many businesses are motivated to deploy additive manufacturing to improve production processes at-scale.

Many businesses faced with increased global competition and rapidly changing market preferences are turning to additive manufacturing to overcome the limitations of conventional manufacturing and provide a competitive advantage. According to an Ernst & Young global survey, 83% of industrial businesses in 2019 were either already applying or considering applying additive manufacturing technologies, a significant increase from 36% in 2016. According to the Wohlers Report 2020, spending on additive manufacturing products and services roughly doubled from $6 billion to $12 billion during this same period. While many businesses still value the rapid prototyping benefits of additive manufacturing, they are also eager to realize benefits largely related to end-use part production. According to Ernst & Young, over 50% of industrial businesses expect to use additive manufacturing to produce products that better meet customer requirements; reduce logistics efforts, transport and inventories; and manufacture existing products at lower costs.

Most existing additive manufacturing technologies primarily focus on design & prototyping applications.

Most commercially available 3D printers leverage legacy additive manufacturing technologies including fused filament fabrication, or FFF, stereolithography, or SLA, and PBF. These first-generation additive technologies build parts by tracing each layer using a single point or multiple points, such as an extrusion nozzle in FFF printers or a laser in SLA and PBF systems. While these technologies have evolved significantly since the early 2000s, they can typically only increase part throughput with additional time or systems, which limits customers’ ability to increase production without also increasing their equipment costs. Many existing additive manufacturing solutions consequently continue to focus on design and prototyping use cases or other low volume production applications where design flexibility and turnaround time are important to customers, but costs and throughput are not.

As a result, businesses still face hurdles in adopting legacy additive manufacturing for end-use production.

While the growth of additive manufacturing has accelerated in recent years, many companies still hesitate to fully adopt the existing, legacy technologies to produce end-use parts, preventing them from realizing the full benefits of additive manufacturing. Ernst & Young found that only 18% of industrial businesses in 2019 used additive manufacturing for end-use parts, lagging other use cases such as rapid prototyping. Because these existing, legacy technologies are better suited to design and prototyping applications, businesses pursuing additive manufacturing solutions face significant barriers to adopting these technologies for end-use applications. Using legacy additive manufacturing technologies to make end-use parts can be expensive, particularly for businesses under margin pressure. This is due to the high costs of legacy additive manufacturing equipment and related consumable materials, which are often priced at high levels by vendors to compensate for the low productivity of their systems. When combined with the limited throughput of these legacy additive manufacturing technologies, high upfront and operating costs result in part costs that typically cannot compete with conventional manufacturing. Consequently, business in industries that require inexpensive parts in large quantities, such as automotive and consumer products, face challenges in adopting additive manufacturing for end-use parts production.

Our Market Opportunity

In part as a result of the drawbacks of these legacy additive manufacturing technologies, businesses of all sizes are engaging Desktop Metal to begin their deployment of additive manufacturing for scalable, end-use parts production. We believe our product portfolio enables customers to capture value at every stage in the product lifecycle, from research and development to the high-volume mass production of end-use parts. We provide easy-to-use, high-throughput, and integrated additive manufacturing solutions

6

Table of Contents

comprised of hardware, software, materials, and services. Our solutions expand the addressable market for additive manufacturing by facilitating applications in vertical markets that have been restricted from adopting additive manufacturing due to cost and productivity hurdles, such as automotive, consumer products, heavy industry and machine design. As a result, we believe we are at the forefront of the next generation of companies that will drive the accelerated adoption of additive manufacturing for end-use parts, whereas legacy additive manufacturing technologies are primarily focused on enabling rapid prototyping. According to the Wohlers Report 2020 and management estimates, this market is expected grow from $12 billion in 2019 to $146 billion in 2030 at compound annual growth rate of approximately 25%, as additive manufacturing displaces conventional manufacturing across a growing range of applications.

Our Growth Strategy

The key elements of our strategy for growth include the following:

Expand our product offerings with a focus on integrated solutions that make additive manufacturing suitable for production applications and accessible to a broad audience.

We believe the adoption of additive manufacturing, particularly for end-use parts, is driven by the availability of solutions that offer a tool-free, digital path to producing large quantities of parts that are both higher performance and lower cost than achievable through conventional manufacturing processes. Our product portfolio includes additive manufacturing technologies designed for volume production, and we intend to continue investing significant resources in enhancing these solutions and developing technologies with breakthrough advances in print speed and other process parameters to deliver the highest throughput systems and lowest part costs in the additive manufacturing market. We believe that such improvements will encourage customer investment in additive manufacturing across a range of industrial applications and vertical markets where conventional manufacturing has customarily held cost and volume advantages. Improved system productivity and economics will expand our market opportunity and enable customers to enjoy the benefits of additive manufacturing at-scale, including lighter, more sustainable parts and a digital supply chain. Our solutions focused on volume production also enable us to capture recurring revenue streams through the sales of consumables and service contracts. We are also committed to lowering the barriers to adopting such additive manufacturing solutions by providing integrated, turnkey experiences that reduce workflow complexity and include all the software, hardware and materials required to produce end-use parts. To accomplish this, we intend to continue investing in software, materials and sintering technologies complementary to our 3D printers that enable ease of use and broad adoption across a wide set of customers with varying levels of experience with additive manufacturing.

Pursue strategic acquisitions and partnerships

We intend to continue to selectively pursue acquisitions and/or equity investments in businesses that represent a strategic fit and are consistent with our overall growth strategy. We believe such transactions would allow us to accelerate market penetration of our additive manufacturing solutions by enabling expansion of our product portfolio, access to new markets, and a stronger value proposition for our customers while delivering margin improvements and increased customer lifetime value. We believe that because of our core focus on engineering and technology development as well as our unique distribution network, we will be able to integrate and drive adoption of new technologies and capabilities acquired via strategic transactions.

Qualify additional materials to reach new verticals and expand our addressable market

Our current product portfolio supports 3D printing using an array of materials, including Polyetheretherketone, or PEEK, and Polyetherketoneketone, or PEKK, composites, stainless steels, tool steels, low alloy steels, copper, precious metals and ceramics, and we are in the process qualifying additional materials for printing. Our metal additive manufacturing systems are designed using sintering-based, powder metallurgy processes, for which there are hundreds of metal alloys and ceramics with well-characterized and high-quality material properties. These powder metallurgy materials offer a broad set of materials for us to evaluate and qualify for use with our metal additive manufacturing solutions. Our Production System solutions also provide open platforms for customers to develop and print with specialized materials that are either proprietary to them or not included on our internal development roadmap. By qualifying additional industrial materials on our systems and enabling customers to do the same, we believe we can serve a broader customer base and address new applications and vertical markets, thereby expanding market share of our solutions and helping drive adoption of additive manufacturing.

7

Table of Contents

Establish a robust parts-as-a-service offering

We envision establishing a parts-as-a-service offering in which we directly manufacture parts for sale to our customers with a focus on key applications and verticals in which additive manufacturing can provide significant performance and cost advantages relative to conventional manufacturing. This offering will enable us to provide a more holistic suite of solutions for our customers. For example, providing parts-as-a-service enables customers to leverage our technology with a lower initial capital expenditure investment before bringing their production in-house when they are ready to purchase our additive manufacturing systems. We believe such services will facilitate lead generation for our additive manufacturing systems at-scale and enable high-performance and specialized applications using new materials ahead of broader market introduction. In addition, as we expand our use of innovative business models such as hardware-as-a-service, in which we provide customers access to our systems on a limited time basis for a recurring annual subscription fee, a parts-as-a-service offering will enable us to leverage depreciated additive manufacturing systems returned by customers upgrading to a newer generation of systems. To date we have not recognized any material revenues from either the parts-as-a-service or the hardware-as-a-service business models.

Extend our distribution channels and reach

We have a leading global distribution network consisting of over 265 resellers, covering more than 60 countries around the world. We intend to extend this distribution network by adding further geographic coverage and sales capacity as well as developing industry-specific expertise to drive penetration in vertical markets such as automotive, aerospace, medical and dental, and consumer products. We also expect to continue building out a high-velocity sales channel for lower price point products, such as Fiber, by partnering with additional volume distributors of software and hardware as well as expanding our internal sales infrastructure and online sales presence. To augment the reach of our distribution network, we intend to grow our direct sales efforts focused primarily on selling our higher priced solutions and serving major accounts and expanding our footprint within multinational and Fortune 500 organizations.

Build a diverse, global customer base

We believe that our success depends, in part, on our ability to develop a diverse, global customer base to reduce risks associated with revenue concentration in any single geographic region or industry. Our customers today include businesses of all sizes, ranging from small and medium enterprises to Fortune 500 organizations and span many industries and applications, including aerospace, automotive, consumer products, medical devices, heavy industry, and research and development. We aim to leverage our global distribution network to reach new customers broadly as well as opportunities in targeted industries and geographies. We believe this diversification will also allow us to identify new applications for which our solutions are appropriate and provide us with customer feedback to assist our product development efforts and ensure we are addressing a broad range of market needs.

Promote awareness through training and education

As businesses increasingly embrace additive manufacturing over the next decade, we intend to educate the market on best practices for adoption of the technology across the entire product life cycle. Our leadership position provides a platform to deliver this education both for our existing customers and the market as a whole. Such education is a critical component of our sales and marketing efforts. We believe businesses that are well-informed or that have firsthand experience of the benefits of our additive manufacturing solutions relative to conventional manufacturing are more likely to purchase and expand their use of our products and services over time. To drive such awareness, we are developing rich additive manufacturing content and curricula for delivery through both online and in-person media, including classes, programs, certifications, and professional services. We also intend to develop global centers of excellence, leveraging our own headquarters in conjunction with our distribution network’s presences, to serve as showrooms, learning facilities and focal points for additive manufacturing-focused professional services.

Our Competitive Strengths

We are a pioneer in the additive manufacturing industry with a mission to make the technology accessible to all designers, engineers, and manufacturers. We believe our collective expertise coupled with the following competitive strengths, will allow us to maintain and extend a leadership position in next-generation additive manufacturing and expand our market opportunity:

8

Table of Contents

Differentiated and proprietary technology platform

We have invested significant resources in developing proprietary technologies across hardware, software and materials science to accelerate the widespread adoption of additive manufacturing. These technologies serve as the foundation of our additive manufacturing solutions. Our key print process innovations include:

Single Pass Jetting, or SPJ. A powder metallurgy-based process in which all the sequential steps of conventional binder jetting are combined and applied with each pass of a single print carriage, leading to significant increases in printer throughput and improvements in part costs.

Bound Metal Deposition, or BMD. A powder metallurgy-based process in which loose powders and dangerous lasers commonly associated with 3D printing are eliminated in favor of bound metal rods to shape parts layer-by-layer, leading to reductions in requirements for special facilities.

Micro Automated Fiber Placement, or Micro AFP. A process in which tape pre-impregnated with continuous fiber, or continuous fiber prepreg tape, is deposited along a part’s critical load paths in combination with chopped fiber filament to build high-strength and high-resolution parts with aerospace- and industrial-grade materials.

In addition to these process innovations, we have developed purpose-built, proprietary sintering technology that delivers industrial-strength sintering in an office-friendly package as well as breakthrough sintering process simulation software. These fundamental technologies represent the cornerstones of our future product introductions and are critical to enhancing our existing offerings. Elements of these technologies and processes are protected by our know-how and by over 202 patents or pending patent applications.

Broad product portfolio

Every organization has a different challenge or application that drives its consideration of additive manufacturing. We offer our customers a range of solutions spanning multiple price points, materials, throughput levels, operating environments, and technologies to enable businesses to find the solution that solves their specific pain point and achieves their goals. Our broad product portfolio covers a spectrum of use cases, scaling with customer needs from entry-level, office-friendly additive manufacturing systems for low volume production of metal or composite parts to high-end, industrial additive manufacturing systems for mass production of low-cost metal parts. In addition, it eliminates the need for customers to source products for different applications from multiple third-party vendors, giving us a market advantage relative to competitors with a more limited set of solutions.

High printer throughput

We believe that our proprietary SPJ technology and each of our binder jet product platforms enables the highest rate of metal parts production among competing additive manufacturing systems for a given layer resolution. The Production System P-50, which is designed to achieve print speeds of up to 12,000 cubic centimeters per hour at a 65-micron printed layer height, can enable customers to manufacture up to hundreds of thousands or even millions of parts per year using additive manufacturing, unlocking new applications due to improved part costs and enhanced design flexibility. Our additive manufacturing solutions employ additional, proprietary technology innovations as a means to overcome some of the challenges that arise with high-speed metal 3D printing and ensure part consistency and accuracy. Through continued advances in underlying hardware and our own technology and processes, we believe that our products’ print speeds will continue to increase, driving down the cost of parts produced on our additive manufacturing systems. This will further differentiate our solutions from competitors while also improving our ability to compete with conventional manufacturing processes at larger quantities of parts and across a wider range of applications.

Integrated, turnkey solutions

We provide our customers with easy-to-use and end-to-end, turnkey solutions for additive manufacturing without the need for additional third-party equipment. We believe our compelling user experience across our product portfolio begins with cohesive and modern software applications for efficient printer build preparation and communication with our additive manufacturing systems, which receive feature enhancements via over-the-air or offline firmware updates. For our solutions related to metal additive manufacturing, which is a complex process that involves multiple steps to go from a digital file to a metal part, we have developed a

9

Table of Contents

furnace using proprietary technology purpose-built to provide industrial strength, partial-pressure and vacuum-enabled sintering in an office-friendly package. Sintering is a critical step for powder metallurgy-based metal additive manufacturing processes. Our furnace, which is designed to achieve temperatures up to 1,400 degrees Celsius and can fit through ADA-compliant doors, enables Studio System and Shop System customers with minimal additive manufacturing experience or materials expertise to process high-density, complex metal parts entirely in-house without third-party equipment required. We also provide a range of consumables and materials optimized for use with our additive manufacturing systems and designed to enable high-quality parts.

Global distribution capabilities

We have developed an industry-leading global distribution network for our metal and composite additive manufacturing solutions consisting of over 265 resellers covering over 60 countries around the world and within a short drive of a significant portion of worldwide manufacturing sector locations. Our resellers, who have extensive experience across digital modeling, 3D printing, and metal manufacturing processes, provide marketing, sales, application engineering, and local support services for end users across an array of vertical markets. They also bring an existing base of customers into which we can drive awareness of and ultimately sell our additive manufacturing solutions.

Visionary and experienced management team

Our management team has deep operational experience bringing emerging technologies to market across the hardware and software sectors. In engineering, we are led by accomplished and visionary technologists across the additive manufacturing, robotics, and materials science industries, including a lead inventor of binder jetting and an industry authority in powder metallurgy. Our commercialization efforts are managed by individuals with prior successes in building and growing indirect, channel-driven sales organizations.

Our Product Platforms
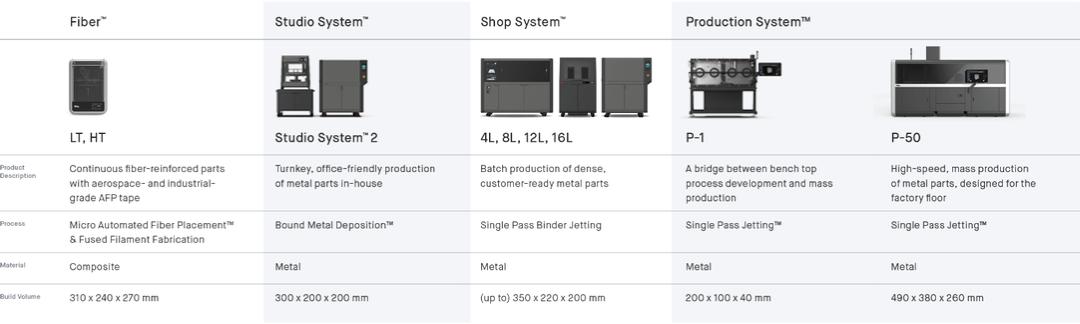
Graphic

Production System

Created by leading inventors of binder jetting and single-pass inkjet technology, Production System technology is designed to be the fastest way to 3D print metal parts at scale. The Production System platform consists of two printer models. The P-1, which began commercial shipments in the fourth quarter of 2020, is a small form factor solution for process and materials development and serial production applications. The P-50, which is scheduled to begin commercial shipments in 2021 and is operational at select early customers today, is a large form factor mass production solution for end-use parts.

Both the Production System P-1 and P-50 leverage our patented SPJ technology, which can achieve print speeds up to 12,000 cubic centimeters per hour at a 65-micron printed layer height. SPJ represents a significant step forward from conventional binder jetting, which uses multiple carriages to complete the steps required to print each layer, including depositing, spreading, and compacting a thin layer of powder in a “build box” and then depositing and drying liquid binding agent, or binder, in the regions that will form parts. The sequential nature of this conventional process adds time per layer and reduces productivity. SPJ consolidates

10

Table of Contents

these steps into the motion of a single print carriage over the build box while advance binder chemistry eliminates the drying step. As a result, SPJ dramatically reduces print time and increases mechanical efficiency. In addition, the Production System P-50 print carriage features a mirrored design that allows it to print bi-directionally, removing wasted motion during printing and delivering speeds up to 100 times those of legacy PBF additive manufacturing technologies. This throughput advantage is reinforced by an open material platform on both Production System models that allows customers to use low-cost, third-party metal injection molding, or MIM, powders. As a result, the Production System P-50 can produce parts at costs competitive with conventional mass production techniques such as casting or MIM for quantities up to hundreds of thousands of units. In addition, the Production System platform enables the re-use of reclaimed metal powder, resulting in near zero waste and further improving part costs.

The Production System platform also leverages other proprietary innovations to ensure accuracy and reliability at high print speeds, including:

Constant wave spreading. During printing, the Production System maintains a constant powder wave in front of printhead carriage, designed to ensure uniform layer thickness and density throughout the entire build box and resulting in more consistent parts within each build.

Anti-ballistics technology. Using patented technology, the Production System maintains a controlled environment below the printhead to minimize binder and powder particle splash back, which can occur during high-speed printing, designed to drastically reduce variability in the printing process while increasing the longevity of the printhead.

Real-time optical bed inspection. An overhead camera monitors each layer to determine print defects and nozzle performance during printing, facilitating part inspection and detects when automated printhead cleaning is required, minimizing and preventing part defects within each build.

Inert processing environment. The Production System operates using an inert, chemically inactive processing environment across the printer and auxiliary processing equipment, including the powder processing unit and powder station. This enables support for a range of both non-reactive and reactive metals in a controlled fashion while also promoting consistent characteristics and quality across printed parts.

Key Production System benefits include:

Excellent part quality. The Production System’s 1200 dots per inch, or DPI, native printhead works in conjunction with constant wave spreading technology to enable the production of dense, high-quality parts capable of performing in the most demanding end-use applications.

Competitive part costs. Customers can achieve part costs competitive with conventional mass production techniques as a result of the Production System’s high-speed 3D printing combined with the ability to densely nest many parts in a single build and support for low-cost MIM powders readily available from third parties.

Leading repeatability. Leveraging patented anti-ballistics technology and real-time optical print bed inspection, the Production System is designed to achieve the robust repeatability required to operate on the factory floor and produce end-use parts at-scale.

Wide material compatibility. An inert processing environment, open material platform, and array of proprietary binders enable the Production System to support a variety of metals, ranging from stainless steels to reactive metals and high-performance super alloys.

Shop System

The Shop System introduces high-quality binder jetting to the machine shop market. With the Shop System, businesses can reliably produce serial batches of complex, end-use metal parts in a fraction of the time and cost of conventional manufacturing and comparably priced additive manufacturing technologies.

11

Table of Contents

Shipping commercially since the fourth quarter of 2020, the Shop System prints using a single-pass binder jetting architecture, in which a high-resolution, page-wide printhead deposits binder in a single pass over the build box and a separate carriage is used for powder spreading. The printhead technology supports small droplet sizes and high nozzle density, enabling the daily production of hundreds of intricate parts with fine features. The Shop System is a turnkey platform with software that allows customers to automatically nest up to hundreds of parts in a single print and a configurable build volume printer designed to scale to a customer’s desired throughput. It also includes a powder station that supports part depowdering prior to sintering, closed-loop powder recycling and our furnace technology with software & profiles optimized for mid-volume throughput of parts.

Key Shop System benefits include:

Easy to use and operate. Designed with the modern machine shop in mind, the Shop System produces parts with excellent surface finish and resolution at the push of a button through its easy-to-use software interface. It features engineered powders and processing parameters optimized for use with the system to deliver exceptional quality and ensure repeatability.

High productivity. Featuring a high-speed, single pass print carriage, the Shop System produces high-quality, complex metal parts up to 10 times the speed and at a fraction of the cost of legacy PBF additive manufacturing technologies, amplifying customers’ existing output with up to hundreds of end-use metal parts per day.

Superior print quality. Customers can print dense, complex parts with incredibly fine feature detail and surface finishes as low as four-micron roughness average (Ra) out of the furnace owing to the Shop System’s high-resolution printhead.

Studio System

The Studio System platform is designed for office-friendly 3D printing. We introduced Studio System 2 in February 2021 as the second generation of this platform. Integrated through Desktop Metal’s cloud-based Fabricate software, this turnkey solution delivers a streamlined and automated workflow for producing complex metal parts in-house via additive manufacturing.

The Studio System 2 leverages our proprietary BMD technology, a powder metallurgy-based additive manufacturing process in which loose powders and dangerous lasers associated with legacy PBF additive manufacturing technologies are eliminated in favor of bound metal rods extruded through a nozzle to shape parts layer-by-layer. BMD minimizes requirements for special facilities or expensive EHS equipment as compared to legacy technologies and improves ease-of-use while enabling new features such as use of closed-cell triply periodic minimal surface, or TPMS, infill for lightweight strength. The Studio System 2 consists of two key components, the printer and furnace, each of which has been designed in-house for simple installation and ease-of-use. In addition, the furnace, which is fully-automated and sized to fit through ADA-compliant doors, is built using proprietary technology that provides industrial-strength, vacuum-enabled sintering in an office friendly package, designed to ensure uniform heating and cooling without the residual stresses introduced into parts by legacy PBF additive manufacturing processes, which can result in poor part performance. Parts produced using the Studio System 2 also feature our patented Separable Supports technology, which enables simplified post-processing and support removal relative to legacy PBF additive manufacturing technologies.

Key Studio System 2 benefits include:

High-quality parts. Users can easily 3D print difficult-to-machine parts with up to 98% density and featuring excellent surface finish and complex geometry like undercuts and internal channels. Fabricate software automates complicated metallurgical processes to produce high-quality parts with densities and feature accuracy similar to casting.

Easy to use. Designed to simplify the otherwise complicated powder metallurgy process, the Studio System 2 is built to make 3D printing metal parts as easy as uploading a design to Fabricate software and pressing print with no guesswork or manual calculations required. Material changeovers are quick and easy, enabled by our unique, hot-swappable material cartridge design.

Designed for the office. The Studio System 2 is designed to seamlessly integrate 3D printing into design and engineering workflows. By eliminating lasers, loose metal powders, and liquid solvents, the system is easy to use in a team’s work environment with no third-party equipment and minimal facilities investment required.

12

Table of Contents

Fiber

Shipping since the fourth quarter of 2020, Fiber is the world’s first desktop 3D printer to fabricate high-resolution parts with aerospace- and industrial-grade continuous fiber composite tape materials used in industrial Automated Fiber Placement, or AFP, processes. Based on our breakthrough Micro AFP technology, customers can now print parts with a superior level of strength and stiffness and in a broad range of materials that traditionally required expensive, industrial AFP systems.

During the Micro AFP process, one Fiber printhead deposits a continuous fiber prepreg tape along critical load paths of a part to build dense, reinforced sections while a second printhead extrudes chopped fiber filament to build a high-resolution exterior shell. The materials used to make the resulting parts are up to two times stronger than steel at one-fifth its weight and up to 75 times stiffer and 60 times stronger than standard FFF polymer materials such as Acrylonitrile Butadiene Styrene, or ABS. To switch between the printheads, Fiber uses a robotic tool changer architecture, which enables future expandability and can store up to four tools, including additional FFF heads for different materials or future enhancements.

Key Fiber benefits include:

Strong parts. Fiber combines the ease-of-use and strong surface finish of FFF printing with the exceptional performance of continuous fiber tape prepreg with high fiber loading and the ability to be layered in multiple orientations based on specific loading conditions, resulting in high-strength parts for demanding applications.

Wide range of materials. To enable a broad set of applications from consumer electronics to automotive, Fiber supports a wide range of fiberglass and carbon fiber-reinforced composites, including PEEK, PEKK, and Nylon (Polyamide 6, or “PA6”) composites, which exhibit excellent mechanical properties, are temperature, chemical, and corrosion resistant, and electrostatic discharge, or ESD, compliant.

Accessible to all. With its easy-to-use platform featuring both entry-level and advanced software settings, and affordable annual subscription pricing models, Fiber offers high-quality composite 3D printing starting at an accessible price point.

Consumable materials

We sell an array of consumable materials, or consumables, for use with several of our currently and soon-to-be shipping additive manufacturing systems. The sales of these materials provide us with a recurring revenue stream from customers of our additive manufacturing solutions. These materials consist of:

BMD materials. For use with the Studio System, we sell metal and ceramic materials, including stainless steels, carbon steels and tool steels. We also continue to develop additional materials including, but not limited to, superalloys and copper, to meet our customers’ needs for new applications and vertical markets. These office-friendly materials are delivered in our unique cartridge-based, rod format, which is a key differentiator for the Studio System as it allows for high metal loading and high-force extrusion during printing, resulting in high density parts with strong mechanical properties, as well as quick and easy material changeovers.

Micro AFP materials. For use with Fiber, we sell both continuous and chopped fiber-reinforced composite materials. Fiber’s Micro AFP tape head deposits aerospace- and industrial-grade continuous fiber prepreg tape while the FFF printhead deposits chopped fiber filament. We provide carbon fiber and fiberglass reinforcement options along with several thermoplastics, including PEEK, PEKK, and Nylon (PA6). This selection of materials enables a range of customer applications requiring high strength, low weight, temperature or chemical resistance, and ESD compliance.

Binder jetting and SPJ materials. For use with the Shop System and Production System, we sell proprietary binders, engineered in-house by our materials team to support a broad array of MIM alloys and to maximize success through each stage of the binder jetting process, resulting in high-resolution parts with exceptional surface finish and strong material properties. While we offer an open platform on the Production System for third-party metal powders, we sell metal powders for use with the Shop System, starting with stainless steels and with additional materials currently in various stages of qualification.

13

Table of Contents

In addition, depending on the product, our consumables may include wear components for our additive manufacturing systems, which require replacement after a specified usage amount or in accordance with predetermined replacement cycles, in order to maintain the proper operations of the equipment.

Software

Software is a key component of our additive manufacturing solutions and is at the core of their accessibility and ease-of-use. Built on cloud, desktop, and mobile technologies, our build preparation software, Fabricate, streamlines the process of setting up prints and provides a cohesive, modern user interface and experience across our product portfolio. In addition to basic features such as automatic support generation, part scaling and positioning, Fabricate also enables the unique features of each of our additive manufacturing systems, such as the ability to configure the quantity, placement, and orientation of continuous fiber tape for Fiber, to adjust closed-cell infill for the Studio System, and to densely nest multiple parts into a build for the Shop System and Production System platforms. The software natively reads commonly used 3D CAD file formats as well as traditional 3D printing file formats, such as STLs.

Our systems each feature onboard, color touchscreen controls and a user-friendly experience consistent with Fabricate. For our cloud-enabled systems, these onboard controls facilitate remote over-the-air updates delivered directly to the equipment, allowing for continuous improvement via new features and enhancements.

In addition, we are developing Live Sinter, a proprietary sintering process simulation software designed to improve part accuracy, reduce sintering support structures and associated costs and minimizing printing trial and error for powder metallurgy-based additive manufacturing processes. We introduced Live Sinter to customers in late 2020 as a companion software product for our Shop System and Production System solutions prior to broader commercialization efforts. This software dynamically simulates the results of the sintering process by leveraging a GPU-accelerated, multi-physics engine in combination with finite element analysis, or FEA, and artificial intelligence. It also automates the compensation of geometries for the distortion and shrinkage that typically occurs during sintering, further optimizing the printing process to create high-accuracy parts.

Customers

Our customers range from small and medium sized enterprises to Fortune 500 companies and represent a broad array of industries, including automotive, aerospace, healthcare, consumer products, heavy industry, machine design, research, and others. No single customer has accounted for more than 10% of our total revenue in 2020.

Research and Development

The additive manufacturing market is undergoing rapid technological advancements across hardware, software, and materials. We invest significant resources into ongoing research and development programs, including $43.1 million and $54.7 million in 2020 and 2019, respectively, because we believe our ability to maintain and extend our market position depends, in part, on breakthrough technologies that offer a unique value proposition for our customers and differentiation versus our competitors. Our research and development team, which is responsible for both the development of new products and improvements to our existing product portfolio, consists of talented and dedicated engineers, technicians, scientists, and professionals with experience from a wide variety of the world’s leading additive manufacturing, robotics, materials, and technology organizations. Our primary areas of focus in research and development include, but are not limited to:

Printing technologies for metals, composites, and polymers focused on driving improvements to speed, ease of use, and part size;

Sintering technology to increase material compatibility and part quality;

Powder metallurgy techniques to minimize part distortion and shrinkage;

Powder processing technology to ensure reliable and repeatable printing at scale;

Binder formulation to enhance the support for additional materials; and

14

Table of Contents

Simulation and artificial intelligence-based software tools to maximize part quality and accuracy.

Sales and Marketing

We sell our additive manufacturing solutions primarily through a global distribution network consisting of over 265 resellers, covering over 60 countries around the world. Our resellers purchase and resell our products to our customers, for whom they also perform installation, application engineering, and local support and maintenance services, with backup services provided by our internal applications engineering and support teams. Our resellers are overseen by Desktop Metal regional channel managers, and most operate on an exclusive basis with respect to the metal additive manufacturing technologies that we offer. Many resellers offer third-party digital manufacturing software, polymer 3D printers, and/or CNC machines in their respective regions, which provides an opportunity to cross-sell our additive manufacturing solutions to a broad, existing customer base that has purchased these other products. To augment the reach of our distribution network, we also intend to grow our direct sales efforts focused primarily on serving major accounts and expanding our footprint within multinational or Fortune 500 organizations.

Our marketing strategies are focused on supporting sales growth by (i) driving awareness; (ii) developing comprehensive sales and marketing content, tools, and campaigns for each stage of the sales process; and (iii) scaling those campaigns via our global distribution network. We drive awareness for Desktop Metal, our additive manufacturing solutions, and our customers’ successes through public relations and communications efforts that span mainstream, business, and trade press across the manufacturing sector generally and in key verticals such as automotive, aerospace, healthcare, consumer products, heavy industry and machine design. Our internal marketing team develops compelling, high-fidelity content in multiple formats and delivery methods to facilitate marketing campaigns and sales enablement.

Manufacturing and Suppliers

Our core hardware products are manufactured via third-party contract manufacturers with international quality certifications, such as ISO 9001, ISO 13485, and ISO/TS 16949. We design the products and processes and internally manufacture the initial engineering prototypes. Our internal manufacturing and supply chain teams work collaboratively with both our internal engineering department and our third-party contract manufacturers to scale up the prototypes for commercialization through a phase gate product launch process. Our third-party contract manufacturers provide a variety of services including sourcing off-the-shelf components, manufacturing custom components/assemblies, final product assembly and integration, end of line testing and quality assurance per our specifications.

We initially manage the supply chain for key components and materials, and then set up supply agreements to ensure stable supply and redundancy where applicable. Depending on the criticality of the component, our internal supply chain group may continue to manage the supplier relationship throughout the life of the product. Commodity hardware items are managed by our contract manufacturer’s sourcing team under a vendor list approved by us to leverage the buying power of their global scale. Commodity consumables are qualified and purchased directly from known industry leaders and provided to the customer to properly support equipment operation. Key consumables used in various printing processes are developed and produced with core partners to ensure protection of intellectual property and production that meets our formula and specifications. Inventory levels are managed with our manufacturing partners to ensure an adequate supply is on hand to meet business forecasts with the ability to produce at multiple locations.

Intellectual Property

Our ability to drive innovation in the additive manufacturing market depends in part upon our ability to protect our core technology and intellectual property. We attempt to protect our intellectual property rights, both in the United States and abroad, through a combination of patent, trademark, copyright and trade secret laws, as well as nondisclosure and invention assignment agreements with our consultants and employees and through non-disclosure agreements with our vendors and business partners. Unpatented research, development, know-how and engineering skills make an important contribution to our business, but we pursue patent protection when we believe it is possible and consistent with our overall strategy for safeguarding intellectual property.

As of December 31, 2020, we own or co-own 34 issued United States patents, 25 issued foreign patents and have 143 pending or allowed patent applications. In addition, we have 8 issued United States trademarks and 8 pending United States trademark

15

Table of Contents

applications. Desktop Metal’s patents and patent applications are directed to, among other things, additive manufacturing and related technologies.

Human Capital

Our employees are critical to our success. As of December 31, 2020, we had 202 full-time employees based primarily in the greater Boston, Massachusetts area. We also engage numerous consultants and contractors to supplement our permanent workforce. A majority of our employees are engaged in research and development and related functions. To date, we have not experienced any work stoppages and consider our relationship with our employees to be in good standing. None of our employees are subject to a collective bargaining agreement or represented by a labor union.

Company Formation

Trine was a blank check company incorporated under the laws of the State of Delaware in September 2018 and Legacy Desktop Metal was incorporated under the laws of the State of Delaware in 2015. On December 9, 2020, we consummated the Business Combination and Trine was renamed to Desktop Metal, Inc. Our principal executive offices are located at 63 Third Avenue in Burlington, Massachusetts 01803. Our website address is www.desktopmetal.com. We have included our website address in this report solely as an inactive textual reference.

Available Information

Copies of the periodic reports that we file with the Securities and Exchange Commission, or SEC, such as our Annual Report on Form 10-K, Quarterly Reports on Form 10-Q, Current Reports on Form 8-K, and any other filings may be obtained by the public, free of charge, by visiting the Investors section of our website at ir.desktopmetal.com, or by contacting our Investor Relations department at our office address listed above. The SEC also maintains a website that contains periodic reports, proxy and information statements and other information regarding issuers that file electronically with the SEC at www.sec.gov The contents of these websites are not incorporated into this filing. Further, our references to the URLs for these websites are intended to be inactive textual references only.

Item 1A. Risk Factors

Summary of Risk Factors

Our business is subject to numerous risks. Below is a summary of the principal factors that could cause our actual results to differ materially from those expressed in forward-looking statements made by us or on our behalf. This summary does not address all of the risks that we face. Additional discussion of the risks summarized in this risk factor summary, and other risks that we face, can be found under the heading “Risk Factors” immediately following this section and should be carefully considered, together with other information in this Annual Report on Form 10-K and our other filings with the SEC, before making an investment decision regarding our Class A common stock.

We are an early-stage company with a history of losses. We have not been profitable historically and may not achieve or maintain profitability in the future.

We may experience difficulties in integrating the operations of EnvisionTEC into our business and in realizing the expected benefits of the EnvisionTEC Acquisition.

We may experience significant delays in the design, production and launch of our additive manufacturing solutions, and we may be unable to successfully commercialize products on our planned timelines.

If demand for our products does not grow as expected, or if market adoption of additive manufacturing does not continue to develop, or develops more slowly than expected, our revenues may stagnate or decline, and our business may be adversely affected.

16

Table of Contents

As part of our growth strategy, we intend to continue to acquire or make investments in other businesses, patents, technologies, products or services. Our failure to do so successfully could disrupt our business and have an adverse impact on our financial condition.

The additive manufacturing industry in which we operate is characterized by rapid technological change, which requires us to continue to develop new products and innovations to meet constantly evolving customer demands and which could adversely affect market adoption of our products.

Future sales, or the perception of future sales, of our Class A common stock by us or our existing stockholders in the public market could cause the market price for our Class A common stock to decline.

We are an “emerging growth company” and the reduced disclosure requirements applicable to emerging growth companies may make our Class A common stock less attractive to investors.

Risk Factors

Our business is subject to numerous risks. You should carefully consider the risks and uncertainties described below and the other information in this Annual Report on Form 10-K before making an investment decision regarding our Class A common stock. Our business, financial condition, results of operations, or prospects could be materially and adversely affected if any of these risks occurs, and as a result, the market price of our Class A common stock could decline, and you could lose all or part of your investment. This Annual Report on Form 10-K also contains forward-looking statements that involve risks and uncertainties. See “Cautionary Note Regarding Forward-Looking Statements.” Our actual results could differ materially and adversely from those anticipated in these forward-looking statements as a result of certain factors, including those set forth below.

Risks Related to Our Financial Position and Need for Additional Capital

We are an early-stage company with a history of losses. We have not been profitable historically and may not achieve or maintain profitability in the future.

We experienced net losses in each year from our inception, including net losses of $90.4 million and $103.6 million for the years ended December 31, 2020 and 2019, respectively. We believe we will continue to incur operating losses and negative cash flow in the near-term as we continue to invest significantly in our business, in particular across our research and development efforts and sales and marketing programs. These investments may not result in increased revenue or growth in our business.

In addition, as a public company, we incur significant additional legal, accounting and other expenses that we did not incur as a private company. These increased expenditures may make it harder for us to achieve and maintain future profitability. Revenue growth and growth in our customer base may not be sustainable, and we may not achieve sufficient revenue to achieve or maintain profitability. While we have generated revenue in the past, we have only recently begun commercial shipments of several of our announced additive manufacturing solutions, some of which are expected to generate a substantial portion of our revenue going forward, and it is difficult for us to predict our future operating results. We may incur significant losses in the future for a number of reasons, including due to the other risks described in this Annual Report on Form 10-K, and we may encounter unforeseen expenses, difficulties, complications and delays and other unknown events. As a result, our losses may be larger than anticipated, we may incur significant losses for the foreseeable future, and we may not achieve profitability when expected, or at all, and even if we do, we may not be able to maintain or increase profitability. Furthermore, if our future growth and operating performance fail to meet investor or analyst expectations, or if we have future negative cash flow or losses resulting from our investment in acquiring customers or expanding our operations, this could have a material adverse effect on our business, financial condition and results of operations.

Our limited operating history and rapid growth makes evaluating our current business and future prospects difficult and may increase the risk of your investment.

Much of our growth has occurred in recent periods. Our limited operating history may make it difficult for you to evaluate our current business and our future prospects, as we continue to grow our business. Our ability to forecast our future operating results is subject to a number of uncertainties, including our ability to plan for and model future growth. We have encountered, and will continue to encounter, risks and uncertainties frequently experienced by growing companies in rapidly evolving industries, as we

17

Table of Contents

continue to grow our business. If our assumptions regarding these uncertainties, which we use to plan our business, are incorrect or change in reaction to changes in our markets, or if we do not address these risks successfully, our operating and financial results could differ materially from our expectations, our business could suffer, and the trading price of our stock may decline. We intend to derive a substantial portion of our revenues from the sales of a number of products which are either in the late stages of development or began commercial shipments in late 2020. We continue to develop additional products which are scheduled to begin commercial shipments in 2021. There are no assurances that we will be able to secure future business with customers or that such products will begin commercial shipments on our planned timelines.

It is difficult to predict our future revenues and appropriately budget for our expenses, and we have limited insight into trends that may emerge and affect our business. If actual results differ from our estimates or we adjust our estimates in future periods, our operating results and financial position could be materially affected.

Our operating results and financial condition may fluctuate from period to period.

Our operating results and financial condition fluctuate from quarter-to-quarter and year-to-year and are likely to continue to vary due to a number of factors, many of which will not be within our control. Both our business and the additive manufacturing industry are changing and evolving rapidly, and our historical operating results may not be useful in predicting our future operating results. If our operating results do not meet the guidance that we provide to the marketplace or the expectations of securities analysts or investors, the market price of our Class A common stock will likely decline. Fluctuations in our operating results and financial condition may be due to a number of factors, including:

the degree of market acceptance of our products and services;

our ability to compete with competitors and new entrants into our markets;

the mix of products and services that we sell during any period;

the timing of our sales and deliveries of our products to customers;

the geographic distribution of our sales;

changes in our pricing policies or those of our competitors, including our response to price competition;

changes in the amount that we spend to develop and manufacture new products or technologies;

changes in the amounts that we spend to promote our products and services;

changes in the cost of satisfying our warranty obligations and servicing our installed customer base;

expenses and/or liabilities resulting from litigation;

delays between our expenditures to develop and market new or enhanced solutions and the generation of revenue from those solutions;

unforeseen liabilities or difficulties in integrating our acquisitions or newly acquired businesses;

disruptions to our information technology systems or our third-party contract manufacturers;

general economic and industry conditions that effect customer demand;

the impact of the COVID-19 pandemic on our customers, suppliers, manufacturers and operations; and

changes in accounting rules and tax laws.

18

Table of Contents

In addition, our revenues and operating results may fluctuate from quarter-to-quarter and year-to-year due to our sales cycle and seasonality among our customers. Generally, our additive manufacturing solutions are subject to the adoption and capital expenditure cycles of our customers. As a result, we typically conduct a larger portion of our business during the first and fourth quarters of our fiscal year relative to the second and third quarters. Additionally, for our more complex solutions, which may require additional facilities investment, potential customers may spend a substantial amount of time performing internal assessments prior to making a purchase decision. This may cause us to devote significant effort in advance of a potential sale without any guarantee of receiving any related revenues. As a result, revenues and operating results for future periods are difficult to predict with any significant degree of certainty, which could lead to adverse effects on our inventory levels and overall financial condition.

Due to the foregoing factors, and the other risks discussed in this Annual Report on Form 10-K, you should not rely on quarter-over-quarter and year-over-year comparisons of our operating results as an indicator of our future performance.

We may require additional capital to support business growth, and this capital might not be available on acceptable terms, if at all.

We intend to continue to make investments to support our business growth and may require additional funds to respond to business challenges and opportunities, including the need to develop new features or enhance our products, improve our operating infrastructure or acquire complementary businesses and technologies. Accordingly, we may need to engage in equity or debt financings to secure additional funds if our existing sources of cash and any funds generated from operations do not provide us with sufficient capital. If we raise additional funds through future issuances of equity or convertible debt securities, our existing stockholders could suffer significant dilution, and any new equity securities we issue could have rights, preferences and privileges superior to those of holders of our Class A common stock. Any debt financing that we may secure in the future could involve restrictive covenants relating to our capital raising activities and other financial and operational matters, which may make it more difficult for us to obtain additional capital and to pursue business opportunities, including potential acquisitions. We may not be able to obtain additional financing on terms favorable to us, if at all. If we are unable to obtain adequate financing or financing on terms satisfactory to us when we require it, our ability to continue to support our business growth and to respond to business challenges and opportunities could be significantly impaired, and our business may be adversely affected.

Risks Related to the EnvisionTEC Acquisition

We may experience difficulties in integrating the operations of EnvisionTEC into our business and in realizing the expected benefits of the EnvisionTEC acquisition.

In February 2021, we acquired EnvisionTEC, Inc., or EnvisionTEC, and certain of its affiliates. Additional information about our acquisition of EnvisionTEC, which we refer to as the EnvisionTEC Acquisition, are set forth in “Note 21. Subsequent Events” to our consolidated financial statements in this Annual Report on Form 10-K. The success of the EnvisionTEC Acquisition will depend in part on our ability to realize the anticipated business opportunities from combining the operations of EnvisionTEC with our business in an efficient and effective manner. The integration process could take longer than anticipated and could result in the loss of key employees, the disruption of each company’s ongoing businesses, tax costs or inefficiencies, or inconsistencies in standards, controls, information technology systems, procedures and policies, any of which could adversely affect our ability to maintain relationships with customers, employees or other third parties, or our ability to achieve the anticipated benefits of the EnvisionTEC Acquisition, and could harm our financial performance. If we are unable to successfully or timely integrate the operations of EnvisionTEC with our business, we may incur unanticipated liabilities and be unable to realize the revenue growth, synergies and other anticipated benefits resulting from the EnvisionTEC Acquisition, and our business, results of operations and financial condition could be materially and adversely affected.

We have incurred significant costs in connection with the EnvisionTEC Acquisition. The substantial majority of these costs are non-recurring expenses related to the EnvisionTEC Acquisition. These non-recurring costs and expenses are reflected in the unaudited pro forma condensed combined financial information included in this Annual Report on Form 10-K. We may incur additional costs in the integration of EnvisionTEC’s business, and may not achieve cost synergies and other benefits sufficient to offset the incremental costs of the EnvisionTEC Acquisition.

19

Table of Contents

Risks Related to Our Business and Industry

Our ability to diversify revenue across product lines will depend on growth in sales of our newly-launched platforms.

The majority of our revenues generated to date have been derived from sales of our Studio System platform, the first generation of which began commercial shipments in the fourth quarter of 2018. If sales of our newly-launched solutions, including Shop System, Production System P-1, and Fiber, fail to materialize or do not grow as anticipated, and if we are unable to continue to successfully commercialize the Studio System platform in the future, we may not achieve our revenue growth targets and our operating results could be harmed.

We may experience significant delays in the design, production and launch of our additive manufacturing solutions, and we may be unable to successfully commercialize products on our planned timelines.

Several of our additive manufacturing solutions are still under development. There are often delays in the design, testing, manufacture and commercial release of new products, and any delay in the launch of our products could materially damage our brand, business, growth prospects, financial condition and operating results. Even if we successfully complete the design, testing and manufacture for one or all of our products under development, we may fail to develop a commercially successful product on the timeline we expect for a number of reasons, including:

misalignment between the products and customer needs;

lack of innovation of the product;

failure of the product to perform in accordance with the customer’s industry standards;

ineffective distribution and marketing;

delay in obtaining any required regulatory approvals;

unexpected production costs; or

release of competitive products.

Our success in the market for the products we develop will depend largely on our ability to prove our products’ capabilities in a timely manner. Upon demonstration, our customers may not believe that our products and/or technology have the capabilities they were designed to have or that we believe they have. Furthermore, even if we do successfully demonstrate our products’ capabilities, potential customers may be more comfortable doing business with another larger and more established company or may take longer than expected to make the decision to order our products. Significant revenue from new product investments may not be achieved for a number of years, if at all. If the timing of our launch of new products and/or of our customers’ acceptance of such products is different than our assumptions, our revenue and results of operations may be adversely affected.

Additionally, we intend to establish a parts-as-a-service offering for customers, which may present similar challenges to those outlined above with respect to the design, production, and launch of new additive manufacturing solutions. In particular, we may fail to develop a commercially successful offering if we are unable to meet customer needs or industry standards, if we fail to meet customer price expectations, or if our marketing and distribution strategy proves ineffective. If we are unable to establish such an offering, sales of our additive manufacturing solutions and our overall operating results could suffer. To date, we have not established a parts-as-a-service offering and have not accepted any orders or recognized any revenue from such an offering.

As part of our growth strategy, we intend to continue to acquire or make investments in other businesses, patents, technologies, products or services. Our failure to do so successfully could disrupt our business and have an adverse impact on our financial condition.

As part of our business strategy, we have entered into, and expect to enter into, agreements to acquire or invest in other companies. To the extent we seek to grow our business through acquisitions, we may not be able to successfully identify attractive

20

Table of Contents

acquisition opportunities or consummate any such acquisitions if we cannot reach an agreement on commercially favorable terms, if we lack sufficient resources to finance the transaction on our own and cannot obtain financing at a reasonable cost or if regulatory authorities prevent such transaction from being consummated. In addition, competition for acquisitions in the markets in which we operate during recent years has increased, and may continue to increase, which may result in an increase in the costs of acquisitions or cause us to refrain from making certain acquisitions. We may not be able to complete future acquisitions on favorable terms, if at all.

If we do complete future acquisitions, we cannot assure you that they will ultimately strengthen our competitive position or that they will be viewed positively by customers, financial markets or investors. Furthermore, future acquisitions could pose numerous additional risks to our operations, including:

diversion of management’s attention from their day-to-day responsibilities;

unanticipated costs or liabilities associated with the acquisition;

incurrence of acquisition-related costs, which would be recognized as a current period expense;

problems integrating the purchased business, products or technologies;

challenges in achieving strategic objectives, cost savings and other anticipated benefits;

inability to maintain relationships with key customers, suppliers, vendors and other third parties on which the purchased business relies;

the difficulty of incorporating acquired technology and rights into our platform and of maintaining quality and security standards consistent with our brand;

difficulty in maintaining controls, procedures and policies during the transition and integration;

challenges in integrating the new workforce and the potential loss of key employees, particularly those of the acquired business; and

use of substantial portions of our available cash or the incurrence of debt to consummate the acquisition.

If we proceed with a particular acquisition, we may have to use cash, issue new equity securities with dilutive effects on existing shareholders, incur indebtedness, assume contingent liabilities or amortize assets or expenses in a manner that might have a material adverse effect on our financial condition and results of operations. Acquisitions will also require us to record certain acquisition-related costs and other items as current period expenses, which would have the effect of reducing our reported earnings in the period in which an acquisition is consummated. In addition, we could also face unknown liabilities or write-offs due to our acquisitions, which could result in a significant charge to our earnings in the period in which they occur. We will also be required to record goodwill or other long-lived asset impairment charges (if any) in the periods in which they occur, which could result in a significant charge to our earnings in any such period.

Achieving the expected returns and synergies from future acquisitions will depend, in part, upon our ability to integrate the products and services, technology, administrative functions and personnel of these businesses into our product lines in an efficient and effective manner. We cannot assure you that we will be able to do so, that our acquired businesses will perform at levels and on the timelines anticipated by our management or that we will be able to obtain these synergies. In addition, acquired technologies and intellectual property may be rendered obsolete or uneconomical by our own or our competitors’ technological advances. Management resources may also be diverted from operating our existing businesses to certain acquisition integration challenges. If we are unable to successfully integrate acquired businesses, our anticipated revenues and profits may be lower. Our profit margins may also be lower, or diluted, following the acquisition of companies whose profit margins are less than those of our existing businesses.

21

Table of Contents

Our business activities may be disrupted due to the outbreak of the COVID-19 pandemic.

We face various risks and uncertainties related to the global outbreak of COVID-19. In recent months, the continued spread of COVID-19 has led to disruption and volatility in the global economy and capital markets, which increases the cost of capital and adversely impacts access to capital. Government-enforced travel bans and business closures around the world have significantly impacted our ability to sell, install and service our additive manufacturing systems at customers around the world. It has, and may continue to, disrupt our third-party contract manufacturers and supply chain. We currently anticipate customer payment delays for our products which could negatively impact our results of operations. We also expect some delays in installation of our products at customers’ facilities, which could lead to postponed revenue recognition for those transactions. Furthermore, if significant portions of our workforce are unable to work effectively, including because of illness, quarantines, government actions, facility closures, remote working or other restrictions in connection with the COVID-19 pandemic, our operations will likely be adversely impacted.

If the COVID-19 pandemic continues for a prolonged duration, we or our customers may be unable to perform fully on our contracts, which will likely result in increases in costs and reduction in revenue. These cost increases may not be fully recoverable or adequately covered by insurance. The long-term effects of COVID-19 to the global economy and to us are difficult to assess or predict and may include a further decline in the market prices of our products, risks to employee health and safety, risks for the deployment of our products and services and reduced sales in geographic locations impacted. Any prolonged restrictive measures put in place in order to control COVID-19 or other adverse public health developments in any of our targeted markets may have a material and adverse effect on our business operations and results of operations.

Changes in our product mix may impact our gross margins and financial performance.

Our financial performance may be affected by the mix of products and services we sell during a given period. Our products are sold, and will continue to be sold, at different price points. Sales of certain of our products have, or are expected to have, higher gross margins than others. If our product mix shifts too far into lower gross margin products, and we are not able to sufficiently reduce the engineering, production and other costs associated with those products or substantially increase the sales of our higher gross margin products, our profitability could be reduced. Additionally, the introduction of new products or services may further heighten quarterly fluctuations in gross profit and gross profit margins due to manufacturing ramp-up and start-up costs. We may experience significant quarterly fluctuations in gross profit margins or operating income or loss due to the impact of the mix of products, channels or geographic areas in which we sell our products from period to period.

If we fail to meet our customers’ price expectations, demand for our products and product lines could be negatively impacted and our business and results of operations could suffer.

Demand for our product lines is sensitive to price. We believe our competitive pricing has been an important factor in our results to date. Therefore, changes in our pricing strategies can have a significant impact on our business and ability to generate revenue. Many factors, including our production and personnel costs and our competitors’ pricing and marketing strategies, can significantly impact our pricing strategies. If we fail to meet our customers’ price expectations in any given period, demand for our products and product lines could be negatively impacted and our business and results of operations could suffer.

We use, and plan to continue using, different pricing models for different products. For example, we plan to use a hardware-as-a-service annual subscription pricing model for certain new products. Such pricing models are still relatively new to some of our customers and may not be attractive to them, especially in regions where they are less common. If customers resist such pricing models, our revenue may be adversely affected, and we may need to restructure the way in which we charge customers for our products. To date, while we have accepted pre-orders for our Fiber solution with hardware-as-a-service annual subscription pricing, we have not recognized material revenue from such orders, or associated with our hardware-as-a-service annual subscription model in general.

Declines in the prices of our products and services, or in our volume of sales, together with our relatively inflexible cost structure, may adversely affect our financial results.

Our business is subject to price competition. Such price competition may adversely affect our results of operation, especially during periods of decreased demand. Decreased demand also adversely impacts the volume of our systems sales. If our business is not

22

Table of Contents

able to offset price reductions resulting from these pressures, or decreased volume of sales due to contractions in the market, by improved operating efficiencies and reduced expenditures, then our operating results will be adversely affected.

Certain of our operating costs are fixed and cannot readily be reduced, which diminishes the positive impact of our restructuring programs on our operating results. To the extent the demand for our products slows, or the additive manufacturing market contracts, we may be faced with excess manufacturing capacity and related costs that cannot readily be reduced, which will adversely impact our financial condition and results of operations.

Our business model is predicated, in part, on building a customer base that will generate a recurring stream of revenues through the sale of our consumables and service contracts. If that recurring stream of revenues does not develop as expected, or if our business model changes as the industry evolves, our operating results may be adversely affected.

Our business model is dependent, in part, on our ability to maintain and increase sales of our proprietary consumables and service contracts as they generate recurring revenues. Existing and future customers of our systems may not purchase our consumables or related service contracts at the same rate at which customers currently purchase those consumables and services. In addition, our entry-level systems focused on low-volume production generally use a lower volume of consumables relative to our higher-end systems focused on high-volume production. If our current and future customers purchase a lower volume of our consumable materials or service contracts, or if our entry-level systems represent an increasing percentage of our future installed customer base, resulting overall in lower purchases of consumables and service contracts on average than our current installed customer base, our recurring revenue stream relative to our total revenues would be reduced and our operating results would be adversely affected.

If demand for our products does not grow as expected, or if market adoption of additive manufacturing does not continue to develop, or develops more slowly than expected, our revenues may stagnate or decline, and our business may be adversely affected.

The industrial manufacturing market, which today is dominated by conventional manufacturing processes that do not involve 3D printing technology, is undergoing a shift towards additive manufacturing. We may not be able to develop effective strategies to raise awareness among potential customers of the benefits of additive manufacturing technologies or our products may not address the specific needs or provide the level of functionality required by potential customers to encourage the continuation of this shift towards additive manufacturing. If additive manufacturing technology does not continue to gain broader market acceptance as an alternative to conventional manufacturing processes, or if the marketplace adopts additive manufacturing technologies that differ from our technologies, we may not be able to increase or sustain the level of sales of our products, and our operating results would be adversely affected as a result.

Reservations for our Production System P-50 solution may not convert to purchase orders.

Our Production System P-50 solution is in the late stages of development, and while select early customers are operational with this solution, commercial shipments are not scheduled to begin until the second half of 2021 and may occur later or not at all. As a result, we have accepted reservations for the Production System P-50, most of which are accompanied by a financial deposit. Given the anticipated lead times between reservations and the date of delivery of the Production System P-50s, there is a risk that customers who place reservations may ultimately decide not to convert such reservations into purchase orders and take delivery of their reserved Production System P-50 due to potential changes in customer preferences, competitive developments or other factors. As a result, no assurance can be made that reservations will result in the purchase of our Production System P-50s, and any such failure to convert these reservations could harm our business, prospects, financial condition and operating results.

Defects in new products or in enhancements to our existing products that give rise to product returns or warranty or other claims could result in material expenses, diversion of management time and attention and damage to our reputation.

Our additive manufacturing solutions are complex and may contain undetected defects or errors when first introduced or as enhancements are released that, despite testing, are not discovered until after a machine has been used. This could result in delayed market acceptance of those products or claims from resellers, customers or others, which may result in litigation, increased end user warranty, support and repair or replacement costs, damage to our reputation and business, or significant costs and diversion of support and engineering personnel to correct the defect or error. We may from time to time become subject to warranty or product liability claims related to product quality issues that could lead us to incur significant expenses.

23

Table of Contents

We attempt to include provisions in our agreements with customers that are designed to limit our exposure to potential liability for damages arising from defects or errors in our products. However, it is possible that these limitations may not be effective as a result of unfavorable judicial decisions or laws enacted in the future.

The sale and support of our products entails the risk of product liability claims. Any product liability claim brought against us, regardless of its merit, could result in material expense, diversion of management time and attention, damage to our business and reputation and brand, and cause us to fail to retain existing customers or to fail to attract new customers.

Our operations could suffer if we are unable to attract and retain key management or other key employees.

We believe our success has depended, and continues to depend, on the efforts and talents of our senior management and other key personnel, including, in particular, our co-founder, chief executive officer, and chairman, Ric Fulop. Our executive team is critical to the management of our business and operations, as well as to the development of our strategy. Members of our senior management team may resign at any time. Our Chief Financial Officer resigned effective as of February 12,2021 and we have appointed a new Chief Financial Officer. The loss of the services of any members of our senior management team, especially Mr. Fulop, could delay or prevent the successful implementation of our strategy or our commercialization of new applications for our systems or other products, or could otherwise adversely affect our ability to manage our company effectively and carry out our business plan. There is no assurance that if any senior executive leaves in the future, we will be able to rapidly replace him or her and transition smoothly towards his or her successor, without any adverse impact on our operations.

To support the continued growth of our business, we must also effectively recruit, hire, integrate, develop, motivate and retain additional new employees. High demand exists for senior management and other key personnel (including scientific, technical, engineering, financial and sales personnel) in the additive manufacturing industry, and there can be no assurance that we will be able to retain our current key personnel. We experience intense competition for qualified personnel. While we intend to continue to provide competitive compensation packages to attract and retain key personnel, some of our competitors for these employees have greater resources and more experience, making it difficult for us to compete successfully for key personnel. Moreover, new employees may not become as productive as we expect since we may face challenges in adequately integrating them into our workforce and culture. If we cannot attract and retain sufficiently qualified technical employees for our research product development activities, as well as experienced sales and marketing personnel, we may be unable to develop and commercialize new products or new applications for existing products. Furthermore, possible shortages of key personnel, including engineers, in the regions surrounding our Boston facility could require us to pay more to hire and retain key personnel, thereby increasing our costs.

All of our U.S. employees are at-will employees, meaning that they may terminate their employment relationship with us at any time, and their knowledge of our business and industry would be extremely difficult to replace. We generally enter into non-competition agreements with our employees. These agreements prohibit our employees from competing directly with us or working for our competitors or clients while they work for us, and in some cases, for a limited period after they cease working for us. We may be unable to enforce these agreements under the laws of the jurisdictions in which our employees work, and it may be difficult for us to restrict our competitors from benefiting from the expertise that our former employees or consultants developed while working for us. If we cannot demonstrate that our legally protectable interests will be harmed, we may be unable to prevent our competitors from benefiting from the expertise of our former employees or consultants and our ability to remain competitive may be diminished.

If we fail to grow our business as anticipated, our net sales, gross margin and operating margin will be adversely affected. If we grow as anticipated but fail to manage our growth and expand our operations accordingly, our business may be harmed and our results of operation may suffer.

Over the past several years, we have experienced rapid growth, and we are attempting to continue to grow our business substantially. To this end, we have made, and expect to continue to make, significant investments in our business, including investments in our infrastructure, technology, marketing and sales efforts. These investments include dedicated facilities expansion and increased staffing, both domestic and international. If our business does not generate the level of revenue required to support our investment, our net sales and profitability will be adversely affected.

Our ability to effectively manage our anticipated growth and expansion of our operations will also require us to enhance our operational, financial and management controls and infrastructure, human resources policies and reporting systems. These enhancements and improvements will require significant capital expenditures, investments in additional headcount and other operating

24

Table of Contents

expenditures and allocation of valuable management and employee resources. Our future financial performance and our ability to execute on our business plan will depend, in part, on our ability to effectively manage any future growth and expansion. There are no guarantees we will be able to do so in an efficient or timely manner, or at all.

Our existing and planned global operations subject us to a variety of risks and uncertainties that could adversely affect our business and operating results. Our business is subject to risks associated with selling machines and other products in non-United States locations.

Our products and services are distributed in more than 60 countries around the world, and we derive a substantial percentage of our sales from these international markets. In 2020, we derived approximately 60% of our revenues from countries outside the United States. Accordingly, we face significant operational risks from doing business internationally.

Our operating results may be affected by volatility in currency exchange rates and our ability to effectively manage our currency transaction risks. We incur currency transaction risks if we were to enter into either a purchase or a sale transaction using a different currency from the currency in which we report revenues. In such cases we may suffer an exchange loss because we do not currently engage in currency swaps or other currency hedging strategies to address this risk. As we realize our strategy to expand internationally, our exposure to currency risks may increase. Given the volatility of exchange rates, we can give no assurance that we will be able to effectively manage our currency transaction risks or that any volatility in currency exchange rates will not have an adverse effect on our results of operations.

Other risks and uncertainties we face from our global operations include:

difficulties in staffing and managing foreign operations;

limited protection for the enforcement of contract and intellectual property rights in certain countries where we may sell our products or work with suppliers or other third parties;

potentially longer sales and payment cycles and potentially greater difficulties in collecting accounts receivable;

costs and difficulties of customizing products for foreign countries;

challenges in providing solutions across a significant distance, in different languages and among different cultures;

laws and business practices favoring local competition;

being subject to a wide variety of complex foreign laws, treaties and regulations and adjusting to any unexpected changes in such laws, treaties and regulations;

specific and significant regulations, including the European Union’s General Data Protection Regulation, or GDPR, which imposes compliance obligations on companies who possess and use data of EU residents;

uncertainty and resultant political, financial and market instability arising from the United Kingdom’s exit from the European Union;

compliance with U.S. laws affecting activities of U.S. companies abroad, including the U.S. Foreign Corrupt Practices Act;

tariffs, trade barriers and other regulatory or contractual limitations on our ability to sell or develop our products in certain foreign markets;

operating in countries with a higher incidence of corruption and fraudulent business practices;

changes in regulatory requirements, including export controls, tariffs and embargoes, other trade restrictions, competition, corporate practices and data privacy concerns;

25

Table of Contents

potential adverse tax consequences arising from global operations;

seasonal reductions in business activity in certain parts of the world, particularly during the summer months in Europe and at year end globally;

rapid changes in government, economic and political policies and conditions; and

political or civil unrest or instability, terrorism or epidemics and other similar outbreaks or events.

In addition, additive manufacturing has been identified by the U.S. government as an emerging technology and is currently being further evaluated for national security impacts. We expect additional regulatory changes to be implemented that will result in increased and/or new export controls related to 3D printing technologies, components and related materials and software. These changes, if implemented, may result in our being required to obtain additional approvals and/or licenses to sell 3D printers in the global market.

Our failure to effectively manage the risks and uncertainties associated with our global operations could limit the future growth of our business and adversely affect our business and operating results.

In the future, some of our arrangements for additive manufacturing solutions may contain customer-specific provisions that may impact the period in which we recognize the related revenues under GAAP.

Some customers that purchase additive manufacturing solutions from us may require specific, customized factors relating to their intended use of the solution or the installation of the product in the customers’ facilities. These specific, customized factors are occasionally required by the customers to be included in our commercial agreements relating to the purchases. As a result, our responsiveness to our customers’ specific requirements has the potential to impact the period in which we recognize the revenue relating to that additive manufacturing system sale.

Similarly, some of our customers must build or prepare facilities to install a subset of our additive manufacturing solutions, and the completion of such projects can be unpredictable, which can impact the period in which we recognize the revenue relating to that additive manufacturing solution sale.

We rely on our information technology systems to manage numerous aspects of our business and a disruption of these systems could adversely affect our business.

We rely on our information technology systems to manage numerous aspects of our business, including to efficiently purchase products from our suppliers, provide procurement and logistic services, ship products to our customers, manage our accounting and financial functions, including our internal controls, and maintain our research and development data. Our information technology systems are an essential component of our business and any disruption could significantly limit our ability to manage and operate our business efficiently. A failure of our information technology systems to perform properly could disrupt our supply chain, product development and customer experience, which may lead to increased overhead costs and decreased sales and have an adverse effect on our reputation and our financial condition. In addition, during the COVID-19 pandemic, a substantial portion of our employees have conducted work remotely, making us more dependent on potentially vulnerable communications systems and making us more vulnerable to cyberattacks.

Although we take steps and incur significant costs to secure our information technology systems, including our computer systems, intranet and internet sites, email and other telecommunications and data networks, our security measures may not be effective and our systems may be vulnerable to damage or interruption. Disruption to our information technology systems could result from power outages, computer and telecommunications failures, computer viruses, cyber-attack or other security breaches, catastrophic events such as fires, floods, earthquakes, tornadoes, hurricanes, acts of war, terrorism and usage errors by our employees.

Our reputation and financial condition could be adversely affected if, as a result of a significant cyber-event or otherwise:

our operations are disrupted or shut down;

26

Table of Contents

our confidential, proprietary information is stolen or disclosed;

we incur costs or are required to pay fines in connection with stolen customer, employee or other confidential information;

we must dedicate significant resources to system repairs or increase cyber security protection; or

we otherwise incur significant litigation or other costs.

If our computer systems are damaged or cease to function properly, or, if we do not replace or upgrade certain systems, we may incur substantial costs to repair or replace them and may experience an interruption of our normal business activities or loss of critical data. Any such disruption could adversely affect our reputation and financial condition.

We also rely on information technology systems maintained by third parties, including third-party cloud computing services and the computer systems of our suppliers for both our internal operations and our customer-facing infrastructure related to our additive manufacturing solutions. These systems are also vulnerable to the types of interruption and damage described above but we have less ability to take measures to protect against such disruptions or to resolve them if they were to occur. Information technology problems faced by third parties on which we rely could adversely impact our business and financial condition as well as negatively impact our brand reputation.

Our current levels of insurance may not be adequate for our potential liabilities.

We maintain insurance to cover our potential exposure for most claims and losses, including potential product and non-product related claims, lawsuits and administrative proceedings seeking damages or other remedies arising out of our commercial operations. However, our insurance coverage is subject to various exclusions, self-retentions and deductibles. We may be faced with types of liabilities that are not covered under our insurance policies, such as environmental contamination or terrorist attacks, or that exceed our policy limits. Even a partially uninsured claim of significant size, if successful, could have an adverse effect on our financial condition.

In addition, we may not be able to continue to obtain insurance coverage on commercially reasonable terms, or at all, and our existing policies may be cancelled or otherwise terminated by the insurer. Maintaining adequate insurance and successfully accessing insurance coverage that may be due for a claim can require a significant amount of our management’s time, and we may be forced to spend a substantial amount of money in that process.

Global economic, political and social conditions and uncertainties in the markets that we serve may adversely impact our business.

Our performance depends on the financial health and strength of our customers, which in turn is dependent on the economic conditions of the markets in which we and our customers operate. The recent declines in the global economy, difficulties in the financial services sector and credit markets, continuing geopolitical uncertainties and other macroeconomic factors all affect the spending behavior of potential customers. The economic uncertainty in Europe, the United States, India, China and other countries may cause end-users to further delay or reduce technology purchases.

We also face risks from financial difficulties or other uncertainties experienced by our suppliers, distributors or other third parties on which we rely. If third parties are unable to supply us with required materials or components or otherwise assist us in operating our business, our business could be harmed.

For example, the possibility of an ongoing trade war between the United States and China may impact the cost of raw materials, finished products or components used in our products and our ability to sell our products in China. Other changes in U.S. social, political, regulatory and economic conditions or in laws and policies governing foreign trade, manufacturing, development and investment could also adversely affect our business. In addition, the ongoing negotiations about transitioning the United Kingdom from the European Union following its formal exit on January 31, 2020 may result in the imposition of tariffs that could have an adverse impact on our results of operation. Additionally, there also is a risk that other countries may decide to leave the European Union. This uncertainty surrounding this transition not only potentially affects our business in the United Kingdom and the European Union, but also may have an effect on global economic conditions and the stability of global financial markets, which in turn could have a material adverse effect on our business, financial condition and results of operations. In extreme cases, we could experience

27

Table of Contents

interruptions in production due to the processing of customs formalities or reduced customer spending in the wake of weaker economic performance. If global economic conditions remain volatile for a prolonged period or if European economies experience further disruptions, our results of operations could be adversely affected.

In connection with the Business Combination, we identified a material weakness in our internal controls over financial reporting. Our internal controls over financial reporting currently do not meet all of the standards contemplated by Section 404 of Sarbanes-Oxley Act of 2002, or the Sarbanes-Oxley Act, and failure to achieve and maintain effective internal controls over financial reporting in accordance with Section 404 of the Sarbanes-Oxley Act could impair our ability to produce timely and accurate financial statements or comply with applicable regulations and have a material adverse effect on our business.

Following the Business Combination, our management has significant requirements for enhanced financial reporting and internal controls as a public company. The process of designing and implementing effective internal controls is a continuous effort that will require us to anticipate and react to changes in our business and the economic and regulatory environments and to expend significant resources to maintain a system of internal controls that is adequate to satisfy our reporting obligations as a public company. If we are unable to establish or maintain appropriate internal financial reporting controls and procedures, it could cause us to fail to meet our reporting obligations on a timely basis or result in material misstatements in our consolidated financial statements, which could harm our operating results. In addition, we will be required, pursuant to Section 404 of the Sarbanes-Oxley Act, to furnish a report by management on, among other things, the effectiveness of our internal control over financial reporting. This assessment will need to include disclosure of any material weaknesses identified by our management in our internal control over financial reporting. The rules governing the standards that must be met for our management to assess our internal control over financial reporting are complex and require significant documentation, testing, and possible remediation. Testing and maintaining internal controls may divert management’s attention from other matters that are important to our business. Our independent registered public accounting firm will be required to attest to the effectiveness of our internal control over financial reporting on an annual basis. However, while we remain an emerging growth company, we will not be required to include an attestation report on internal control over financial reporting issued by our independent registered public accounting firm. If we are not able to complete our initial assessment of our internal controls and otherwise implement the requirements of Section 404 of the Sarbanes-Oxley Act in a timely manner or with adequate compliance, our independent registered public accounting firm may not be able to certify as to the adequacy of our internal controls over financial reporting.

In addition to our results determined in accordance with GAAP, we believe certain non-GAAP measures may be useful in evaluating our operating performance. We present certain non-GAAP financial measures in this Annual Report on Form 10-K and intend to continue to present certain non-GAAP financial measures in future filings with the SEC and other public statements. Any failure to accurately report and present our non-GAAP financial measures could cause investors to lose confidence in our reported financial and other information, which would likely have a negative effect on the trading price of our Class A common stock.

Matters impacting our internal controls may cause us to be unable to report our financial information on a timely basis and thereby subject us to adverse regulatory consequences, including sanctions by the SEC or violations of applicable NYSE listing rules, which may result in a breach of the covenants under existing or future financing arrangements. There also could be a negative reaction in the financial markets due to a loss of investor confidence in us and the reliability of our financial statements. Confidence in the reliability of our financial statements also could suffer if we or our independent registered public accounting firm continue to report a material weakness in our internal controls over financial reporting. This could materially adversely affect us and lead to a decline in the market price of our Class A common stock.

In connection with the Business Combination, our management and auditors determined that a material weakness existed in our internal control over financial reporting due to the fact that we had not completed an annual or quarterly close under a timeline that would be compatible with public company filing deadlines, and with our limited accounting department personnel, this may not be achievable. A material weakness is a deficiency, or combination of deficiencies, in internal control over financial reporting such that there is a reasonable possibility that a material misstatement of our annual or interim consolidated financial statements will not be prevented or detected on a timely basis. While we have instituted plans to remediate the issue described above and continue to take remediation steps, including hiring additional personnel, including a vice president of accounting with public company experience, we continued to have a limited number of personnel with the level of GAAP accounting knowledge, specifically related to complex accounting transactions, commensurate with our financial reporting requirements.

28

Table of Contents

Although we believe the hiring of additional accounting resources, implementation of additional reviews and processes requiring timely account reconciliations and analysis and implementation of processes and controls to better identify and manage segregation of duties will remediate the material weakness with respect to insufficient personnel, there can be no assurance that the material weakness will be remediated on a timely basis or at all, or that additional material weaknesses will not be identified in the future. If we are unable to remediate the material weakness, our ability to record, process, and report financial information accurately, and to prepare financial statements within the time periods specified by the rules and forms of the SEC, could be adversely affected which, in turn, to may adversely affect our reputation and business and the market price of our Class A common stock.

The additive manufacturing industry in which we operate is characterized by rapid technological change, which requires us to continue to develop new products and innovations to meet constantly evolving customer demands and which could adversely affect market adoption of our products.

Our revenues are derived from the sale of additive manufacturing systems and related consumables and services. We have encountered and will continue to encounter challenges experienced by growing companies in a market subject to rapid innovation and technological change. While we intend to invest substantial resources to remain on the forefront of technological development, continuing advances in additive manufacturing technology, changes in customer requirements and preferences and the emergence of new standards, regulations and certifications could adversely affect adoption of our products either generally or for particular applications. Our ability to compete in the additive manufacturing market depends, in large part, on our success in developing and introducing new additive manufacturing systems and technology, in improving our existing products and technology and qualifying new materials which our systems can support. We believe that we must continuously enhance and expand the functionality and features of our products and technologies in order to remain competitive. However, we may not be able to:

develop cost effective new products and technologies that address the increasingly complex needs of prospective customers;

enhance our existing products and technologies;

respond to technological advances and emerging industry standards and certifications on a cost-effective and timely basis;

adequately protect our intellectual property as we develop new products and technologies;

identify the appropriate technology or product to which to devote our resources; or

ensure the availability of cash resources to fund research and development.

Even if we successfully introduce new additive manufacturing products and technologies and enhance our existing products and technologies, it is possible that these will eventually supplant our existing products or that our competitors will develop new products and technologies that will replace our own. As a result, any of our products may be rendered obsolete or uneconomical by our or our competitors’ technological advances, leading to a loss in market share, decline in revenue and adverse effects to our business and prospects.

The additive manufacturing industry is competitive. We expect to face increasing competition in many aspects of our business, which could cause our operating results to suffer.

The additive manufacturing industry in which we operate is fragmented and competitive. We compete for customers with a wide variety of producers of additive manufacturing and/or 3D printing equipment that creates 3D objects and end-use parts, as well as with providers of materials and services for this equipment. Some of our existing and potential competitors are researching, designing, developing and marketing other types of products and services that may render our existing or future products obsolete, uneconomical or less competitive. Existing and potential competitors may also have substantially greater financial, technical, marketing and sales, manufacturing, distribution and other resources than we do, including name recognition, as well as experience and expertise in intellectual property rights and operating within certain international markets, any of which may enable them to compete effectively against us. For example, a number of companies that have substantial resources have announced that they are beginning production of 3D printing systems, which will further enhance the competition we face.

29

Table of Contents

Future competition may arise from the development of allied or related techniques for equipment, materials and services that are not encompassed by our patents, from the issuance of patents to other companies that may inhibit our ability to develop certain products and from improvements to existing technologies.

We intend to continue to follow a strategy of continuing product development and distribution network expansion to enhance our competitive position to the extent practicable. But we cannot assure you that we will be able to maintain our current position or continue to compete successfully against current and future sources of competition. If we do not keep pace with technological change and introduce new products and technologies, demand for our products may decline, and our operating results may suffer.

Because the additive manufacturing market is rapidly evolving, forecasts of market growth in this Annual Report on Form 10-K may not be accurate.

Market opportunity estimates and growth forecasts included in this Annual Report on Form 10-K are subject to significant uncertainty and are based on assumptions and estimates that may not prove to be accurate. The forecasts and estimates in this Annual Report on Form 10-K relating to the expected size and growth of the markets for additive manufacturing technology and other markets in which we participate may prove to be inaccurate. Even if these markets experience the forecasted growth described in this Annual Report on Form 10-K, we may not grow our business at similar rates, or at all. Our future growth is subject to many factors, including market adoption of our products, which is subject to many risks and uncertainties. Accordingly, the forecasts and estimates of market size and growth described in this Annual Report on Form 10-K, including our estimates that the size of the total addressable market is expected to be approximately $146 billion in 2030, should not be taken as indicative of our future growth. In addition, these forecasts do not consider the impact of the current global COVID-19 pandemic, and we cannot assure you that these forecasts will not be materially and adversely affected as a result.

Risks Related to Third Parties

We could be subject to personal injury, property damage, product liability, warranty and other claims involving allegedly defective products that we supply.

The products we supply are sometimes used in potentially hazardous or critical applications, such as the assembled parts of an aircraft, medical device or automobile, that could result in death, personal injury, property damage, loss of production, punitive damages and consequential damages. While we have not experienced any such claims to date, actual or claimed defects in the products we supply could result in our being named as a defendant in lawsuits asserting potentially large claims.

We attempt to include legal provisions in our agreements with customers that are designed to limit our exposure to potential liability for damages arising from defects or errors in our products. However, it is possible that these limitations may not be effective as a result of unfavorable judicial decisions or laws enacted in the future. Any such lawsuit, regardless of merit, could result in material expense, diversion of management time and efforts and damage to our reputation, and could cause us to fail to retain or attract customers, which could adversely affect our results of operations.

We could face liability if our additive manufacturing solutions are used by our customers to print dangerous objects.

Customers may use our additive manufacturing systems to print parts that could be used in a harmful way or could otherwise be dangerous. For example, there have been news reports that 3D printers were used to print guns or other weapons. We have little, if any, control over what objects our customers print using our products, and it may be difficult, if not impossible, for us to monitor and prevent customers from printing weapons with our products. While we have never printed weapons on any printers in our offices, there can be no assurance that we will not be held liable if someone were injured or killed by a weapon printed by a customer using one of our products.

30

Table of Contents

We depend on our network of resellers and our business could be adversely affected if they do not perform as expected.

We rely heavily on our global network of resellers to sell our products and to provide installation and support services to customers in their respective geographic regions. These resellers may not be as effective in selling our products or installing and supporting our customers as we expect. Further, our contracts with our resellers provide for termination for convenience, and if our contracts with a significant number of resellers, or with the most effective resellers, were to terminate or if they would otherwise fail or refuse to sell certain of our products, we may not be able to find replacements that are as qualified or as successful in a timely manner, if at all. In addition, if our resellers do not perform as anticipated, or if we are unable to secure qualified and successful resellers, our sales will suffer, which would have an adverse effect on our revenues and operating results. Because we also depend upon our resellers to provide installation and support services for products, if our reseller relationship were terminated or limited to certain products, we may face disruption in providing support for our customers, which would adversely affect our reputation and our results of operations. Any failure to offer high-quality technical support services may adversely affect our relationships with our customers and adversely affect our financial results.

Additionally, a default by one or more resellers that have a significant receivables balance could have an adverse financial impact on our financial results. We have reviewed our policies that govern credit and collections and will continue to monitor them in light of current payment status and economic conditions. In addition, we try to reduce the credit exposures of our accounts receivable by instituting credit limits and having credit insurance. However, there can be no assurance that our efforts to identify potential credit risks will be successful. Our inability to timely identify resellers that are credit risks could result in defaults at a time when such resellers have high accounts receivable balances with us. Any such default would result in a significant charge against our earnings and adversely affect our results of operations and financial condition.

We depend on a limited number of third-party contract manufacturers for substantially all of our manufacturing needs. If these third-party manufacturers experience any delay, disruption or quality control problems in their operations, including due to the COVID-19 pandemic, we could lose market share and our brand may suffer.

We depend on third-party contract manufacturers for the production of our additive manufacturing systems. While there are several potential manufacturers for most of these products, all of our products are manufactured, assembled, tested and generally packaged by a limited number of third-party manufacturers. In most cases, we rely on these manufacturers to procure components and, in some cases, subcontract engineering work. Our reliance on a limited number of contract manufacturers involves a number of risks, including:

unexpected increases in manufacturing and repair costs;

inability to control the quality and reliability of finished products;

inability to control delivery schedules;

potential liability for expenses incurred by third-party contract manufacturers in reliance on our forecasts that later prove to be inaccurate;

potential lack of adequate capacity to manufacture all or a part of the products we require; and

potential labor unrest affecting the ability of the third-party manufacturers to produce our products.

If any of our third-party contract manufacturers experience a delay, disruption or quality control problems in their operations, including due to the COVID-19 pandemic, or if a primary third-party contract manufacturer does not renew its agreement with us, our operations could be significantly disrupted, and our product shipments could be delayed. Qualifying a new manufacturer and commencing volume production is expensive and time consuming. Ensuring that a contract manufacturer is qualified to manufacture our products to our standards is time consuming. In addition, there is no assurance that a contract manufacturer can scale its production of our products at the volumes and in the quality that we require. If a contract manufacturer is unable to do these things, we may have to move production for the products to a new or existing third-party manufacturer, which would take significant effort and our business, results of operations and financial condition could be materially adversely affected.

31

Table of Contents

As we contemplate moving manufacturing into different jurisdictions, we may be subject to additional significant challenges in ensuring that quality, processes, and costs, among other issues, are consistent with our expectations. For example, while we expect our third-party contract manufacturers to be responsible for penalties assessed on us because of excessive failures of the products, there is no assurance that we will be able to collect such reimbursements from these manufacturers, which causes us to take on additional risk for potential failures of our products.

In addition, because we use a limited number of third-party contract manufacturers, increases in the prices charged may have an adverse effect on our results of operations, as we may be unable to find a contract manufacturer who can supply us at a lower price. As a result, the loss of a limited source supplier could adversely affect our relationships with our customers and our results of operations and financial condition.

All of our products must satisfy safety and regulatory standards and some of our products must also receive government certifications. Our third-party contract manufacturers are primarily responsible for conducting the tests that support our applications for most regulatory approvals for our products. If our third-party contract manufacturers fail to timely and accurately conduct these tests, we may be unable to obtain the necessary domestic or foreign regulatory approvals or certifications to sell our products in certain jurisdictions. As a result, we would be unable to sell our products and our sales and profitability could be reduced, our relationships with our sales channel could be harmed and our reputation and brand would suffer.

If our suppliers become unavailable or inadequate, our customer relationships, results of operations and financial condition may be adversely affected.

We acquire certain of our materials, which are critical to the ongoing operation and future growth of our business, from several third parties. Generally, our third-party contract manufacturers contract directly with component suppliers and we rely on our contract manufacturers to manage their supply chains. If one of our contract manufacturers has a supply chain disruption, or our relationship with our contract manufacturer terminates, we could experience delays. We also source some materials directly from suppliers. While most manufacturing equipment and materials for our products are available from multiple suppliers, certain of those items are only available from limited sources. Should any of these suppliers become unavailable or inadequate, or impose terms unacceptable to us, such as increased pricing terms, we could be required to spend a significant amount of time and expense to develop alternate sources of supply, and we may not be successful in doing so on terms acceptable to us, or at all. As a result, the loss of a limited source supplier could adversely affect our relationship with our customers as well as our results of operations and financial condition.

Our third-party contract manufacturers’ facilities, and our suppliers’ and our customers’ facilities, are vulnerable to disruption due to natural or other disasters, strikes and other events beyond our control.

A major earthquake, fire, tsunami, hurricane, cyclone or other disaster, such as a pandemic, major flood, seasonal storms, nuclear event or terrorist attack affecting our facilities or the areas in which they are located, or affecting those of our customers or third-party manufacturers or suppliers, could significantly disrupt our or their operations and delay or prevent product shipment or installation during the time required to repair, rebuild or replace our or their damaged manufacturing facilities. These delays could be lengthy and costly. If any of our third-party contract manufacturers’, suppliers’ or customers’ facilities are negatively impacted by such a disaster, production, shipment and installation of our 3D printing machines could be delayed, which can impact the period in which we recognize the revenue related to that 3D printing machine sale. Additionally, customers may delay purchases of our products until operations return to normal. Even if we are able to respond quickly to a disaster, the continued effects of the disaster could create uncertainty in our business operations. In addition, concerns about terrorism, the effects of a terrorist attack, political turmoil, labor strikes, war or the outbreak of epidemic diseases (including the outbreak of COVID-19) could have a negative effect on our operations and sales.

Risks Related to Compliance Matters

Failure of our global operations to comply with anti-corruption laws and various trade restrictions, such as sanctions and export controls, could have an adverse effect on our business.

We operate in a number of countries throughout the world, including countries known to have a reputation for corruption. Doing business on a global basis requires us to comply with anti-corruption laws and regulations imposed by governments around the world with jurisdiction over our operations, including the U.S. Foreign Corrupt Practices Act and the U.K. Bribery Act 2010, as well as the

32

Table of Contents

laws of the countries where we do business. We are also subject to various trade restrictions, including trade and economic sanctions and export controls, imposed by governments around the world with jurisdiction over our operations. For example, in accordance with trade sanctions administered by the Office of Foreign Assets Control and the U.S. Department of Commerce, we are prohibited from engaging in transactions involving certain persons and certain designated countries or territories, including Cuba, Iran, Syria, North Korea and the Crimea Region of Ukraine. In addition, our products are subject to export regulations that can involve significant compliance time and may add additional overhead cost to our products. In recent years the U.S. government has had a renewed focus on export matters. For example, the Export Control Reform Act of 2018 and regulatory guidance have imposed additional controls, and may result in the imposition of further additional controls, on the export of certain “emerging and foundational technologies.” Our current and future products may be subject to these heightened regulations, which could increase our compliance costs.

We are committed to doing business in accordance with applicable anti-corruption laws and regulations and with applicable trade restrictions. We are subject, however, to the risk that our affiliated entities or our and our affiliates’ respective officers, directors, employees and agents (including distributors of our products) may take action determined to be in violation of such laws and regulations. Any violation by any of these persons could result in substantial fines, sanctions, civil and/or criminal penalties, or curtailment of operations in certain jurisdictions, and might adversely affect our operating results. In addition, actual or alleged violations could damage our reputation and ability to do business.

We are subject to environmental, health and safety laws and regulations related to our operations and the use of our additive manufacturing systems and consumable materials, which could subject us to compliance costs and/or potential liability in the event of non-compliance.

We are subject to domestic and foreign environmental laws and regulations governing our operations, including, but not limited to, emissions into the air and water and the use, handling, disposal and remediation of hazardous substances. A certain risk of environmental liability is inherent in our production activities. These laws and regulations govern, among other things, the generation, use, storage, registration, handling and disposal of chemicals and waste materials, the presence of specified substances in electrical products, the emission and discharge of hazardous materials into the ground, air or water, the cleanup of contaminated sites, including any contamination that results from spills due to our failure to properly dispose of chemicals and other waste materials and the health and safety of our employees. Under these laws, regulations and requirements, we could also be subject to liability for improper disposal of chemicals and waste materials, including those resulting from the use of our systems and accompanying materials by end-users. Accidents or other incidents that occur at our facilities or involve our personnel or operations could result in claims for damages against us. In the event we are found to be financially responsible, as a result of environmental or other laws or by court order, for environmental damages alleged to have been caused by us or occurring on our premises, we could be required to pay substantial monetary damages or undertake expensive remedial obligations. If our operations fail to comply with such laws or regulations, we may be subject to fines and other civil, administrative or criminal sanctions, including the revocation of permits and licenses necessary to continue our business activities. In addition, we may be required to pay damages or civil judgments in respect of third-party claims, including those relating to personal injury (including exposure to hazardous substances that we generate, use, store, handle, transport, manufacture or dispose of), property damage or contribution claims. Some environmental laws allow for strict, joint and several liabilities for remediation costs, regardless of fault. We may be identified as a potentially responsible party under such laws. The amount of any costs, including fines or damages payments that we might incur under such circumstances could substantially exceed any insurance we have to cover such losses. Any of these events, alone or in combination, could have a material adverse effect on our business, financial condition and results of operations and could adversely affect our reputation.

The export of our products internationally from our production facilities subjects us to environmental laws and regulations concerning the import and export of chemicals and hazardous substances such as the United States Toxic Substances Control Act and the Registration, Evaluation, Authorization and Restriction of Chemical Substances. These laws and regulations require the testing and registration of some chemicals that we ship along with, or that form a part of, our systems and other products. If we fail to comply with these or similar laws and regulations, we may be required to make significant expenditures to reformulate the chemicals that we use in our products and materials or incur costs to register such chemicals to gain and/or regain compliance. Additionally, we could be subject to significant fines or other civil and criminal penalties should we not achieve such compliance.

The cost of complying with current and future environmental, health and safety laws applicable to our operations, or the liabilities arising from past releases of, or exposure to, hazardous substances, may result in future expenditures. Any of these developments, alone or in combination, could have an adverse effect on our business, financial condition and results of operations.

33

Table of Contents

Aspects of our business are subject to privacy, data use and data security regulations, which could increase our costs.

We collect personally identifiable information from our employees, prospects, and our customers. Privacy and security laws and regulations may limit the use and disclosure of certain information and require us to adopt certain cybersecurity and data handling practices that may affect our ability to effectively market our services to current, past or prospective customers. We must comply with privacy laws in the United States, Europe and elsewhere, including GDPR in the European Union, which became effective May 25, 2018, and the California Consumer Privacy Act of 2018, which was enacted on June 28, 2018 and became effective on January 1, 2020. These laws create new individual privacy rights and impose increased obligations, including disclosure obligations, on companies handling personal data. In many jurisdictions, consumers must be notified in the event of a data security breach, and such notification requirements continue to increase in scope and cost. Privacy and security laws and regulations may limit the use and disclosure of certain information and require us to adopt certain cybersecurity and data handling practices that may affect our ability to effectively market our services to current, past or prospective customers. While we have invested in, and intend to continue to invest in, resources to comply with these standards, we may not be successful in doing so, and any such failure could have an adverse effect on our business, results of operations and reputation.

As privacy, data use and data security laws are interpreted and applied, compliance costs may increase, particularly in the context of ensuring that adequate data protection and data transfer mechanisms are in place. In recent years, there has been increasing regulatory enforcement and litigation activity in this area in the United States, Germany and in various other countries in which we operate.

Risks Related to Intellectual Property

Third-party lawsuits and assertions to which we are subject alleging our infringement of patents, trade secrets or other intellectual property rights may have a significant adverse effect on our financial condition.

Third parties may own issued patents and pending patent applications that exist in fields relevant to additive manufacturing. Some of these third parties may assert that we are employing their proprietary technology without authorization. There may be third-party patents or patent applications with claims related to additive manufacturing. Because patent applications can take many years to issue, there may be currently pending patent applications which may later result in issued patents that our additive technologies may infringe. In addition, third parties may obtain patents in the future and claim that our technologies infringe upon these patents. Any third-party lawsuits or other assertion to which we are subject alleging our infringement of patents, trade secrets or other intellectual property rights may have a significant adverse effect on our financial condition.

We may incur substantial costs enforcing and defending our intellectual property rights.

We may incur substantial expense and costs in protecting, enforcing and defending our intellectual property rights against third parties. Intellectual property disputes may be costly and can be disruptive to our business operations by diverting attention and energies of management and key technical personnel and by increasing our costs of doing business. Third-party intellectual property claims asserted against us could subject us to significant liabilities, require us to enter into royalty and licensing arrangements on unfavorable terms, prevent us from assembling or licensing certain of our products, subject us to injunctions restricting our sale of products, cause severe disruptions to our operations or the marketplaces in which we compete or require us to satisfy indemnification commitments with our customers, including contractual provisions under various license arrangements. In addition, we may incur significant costs in acquiring the necessary third-party intellectual property rights for use in our products. Any of these could have an adverse effect on our business and financial condition.

If we are unable to adequately protect or enforce our intellectual property rights, such information may be used by others to compete against us, in particular in developing consumables that could be used with our printing systems in place of our proprietary consumables.

We have devoted substantial resources to the development of our technology and related intellectual property rights. Our success and future revenue growth will depend, in part, on our ability to protect our intellectual property. We rely on a combination of registered and unregistered intellectual property and protect our rights using patents, licenses, trademarks, trade secrets, confidentiality and assignment of invention agreements and other methods.

34

Table of Contents

Despite our efforts to protect our proprietary rights, it is possible that competitors or other unauthorized third parties may obtain, copy, use or disclose our technologies, inventions, processes or improvements. We cannot assure you that any of our existing or future patents or other intellectual property rights will not be challenged, invalidated or circumvented, or will otherwise provide us with meaningful protection. Our pending patent applications may not be granted, and we may not be able to obtain foreign patents or pending applications corresponding to our U.S. patents. Even if foreign patents are granted, effective enforcement in foreign countries may not be available.

Our trade secrets, know-how and other unregistered proprietary rights are a key aspect of our intellectual property portfolio. While we take reasonable steps to protect our trade secrets and confidential information and enter into confidentiality and invention assignment agreements intended to protect such rights, such agreements can be difficult and costly to enforce or may not provide adequate remedies if violated, and we may not have entered into such agreements with all relevant parties. Such agreements may be breached, and trade secrets or confidential information may be willfully or unintentionally disclosed, including by employees who may leave our company and join our competitors, or our competitors or other parties may learn of the information in some other way. The disclosure to, or independent development by, a competitor of any of our trade secrets, know-how or other technology not protected by a patent or other intellectual property system could materially reduce or eliminate any competitive advantage that we may have over such competitor. This concern could manifest itself in particular with respect to our proprietary consumables that are used with our systems. Portions of our proprietary consumables may not be afforded patent protection. Chemical companies or other producers of raw materials used in our consumables may be able to develop consumables that are compatible to a large extent with our products, whether independently or in contravention of our trade secret rights and related proprietary and contractual rights. If such consumables are made available to owners of our systems, and are purchased in place of our proprietary consumables, our revenues and profitability would be reduced, and we could be forced to reduce prices for our proprietary consumables.

If our patents and other intellectual property do not adequately protect our technology, our competitors may be able to offer products similar to ours. Our competitors may also be able to develop similar technology independently or design around our patents and other intellectual property. Any of the foregoing events would lead to increased competition and reduce our revenue or gross margin, which would adversely affect our operating results.

If we attempt enforcement of our intellectual property rights, we may be, and have been in the past, subject or party to claims, negotiations or complex, protracted litigation. Intellectual property disputes and litigation, regardless of merit, can be costly and disruptive to our business operations by diverting attention and energies of management and key technical personnel and by increasing our costs of doing business. Any of the foregoing could adversely affect our business and financial condition.

As part of any settlement or other compromise to avoid complex, protracted litigation, we may agree not to pursue future claims against a third party, including related to alleged infringement of our intellectual property rights. Part of any settlement or other compromise with another party may resolve a potentially costly dispute but may also have future repercussions on our ability to defend and protect our intellectual property rights, which in turn could adversely affect our business.

Our additive manufacturing software contains third-party open-source software components, and failure to comply with the terms of the underlying open-source software licenses could restrict our ability to sell our products.

Our additive manufacturing software contains components that are licensed under so-called “open source,” “free” or other similar licenses. Open source software is made available to the general public on an “as-is” basis under the terms of a non-negotiable license. We currently combine our proprietary software with open source software, but not in a manner that we believe requires the release of the source code of our proprietary software to the public. We do not plan to integrate our proprietary software with open source software in ways that would require the release of the source code of our proprietary software to the public; however, our use and distribution of open source software may entail greater risks than use of third-party commercial software. Open source licensors generally do not provide warranties or other contractual protections regarding infringement claims or the quality of the code. In addition, if we combine our proprietary software with open source software in a certain manner, we could, under certain open source licenses, be required to release to the public or remove the source code of our proprietary software. We may also face claims alleging noncompliance with open source license terms or infringement or misappropriation of proprietary software. These claims could result in litigation, require us to purchase a costly license or remove the software. In addition, if the license terms for open source software that we use change, we may be forced to re-engineer our solutions, incur additional costs or discontinue the sale of our offerings if re-engineering could not be accomplished on a timely basis. Although we monitor our use of open source software to avoid subjecting our offerings to unintended conditions, there is a risk that these licenses could be construed in a way that could impose unanticipated

35

Table of Contents

conditions or restrictions on our ability to commercialize our offerings. We cannot guarantee that we have incorporated open source software in our software in a manner that will not subject us to liability or in a manner that is consistent with our current policies and procedures.

Risks Related to Our Class A Common Stock

Our issuance of additional shares of Class A common stock or convertible securities may dilute your ownership of us and could adversely affect our stock price.

From time to time, we have issued, and we expect in the future to issue, additional shares of our Class A common stock or securities convertible into our Class A common stock pursuant to a variety of transactions, including acquisitions. Additional shares of our Class A common stock may also be issued upon exercise of outstanding stock options and warrants to purchase our Class A common stock. The issuance by us of additional shares of our Class A common stock or securities convertible into our Class A common stock would dilute your ownership of us and the sale of a significant amount of such shares in the public market could adversely affect prevailing market prices of our Class A common stock. Subject to the satisfaction of vesting conditions and the expiration of lockup agreements, shares issuable upon exercise of options will be available for resale immediately in the public market without restriction.

In the future, we expect to obtain financing or to further increase our capital resources by issuing additional shares of our capital stock or offering debt or other equity securities, including senior or subordinated notes, debt securities convertible into equity, or shares of preferred stock. Issuing additional shares of our capital stock, other equity securities, or securities convertible into equity may dilute the economic and voting rights of our existing stockholders, reduce the market price of our Class A common stock, or both. Debt securities convertible into equity could be subject to adjustments in the conversion ratio pursuant to which certain events may increase the number of equity securities issuable upon conversion. Preferred stock, if issued, could have a preference with respect to liquidating distributions or a preference with respect to dividend payments that could limit our ability to pay dividends to the holders of our Class A common stock. Our decision to issue securities in any future offering will depend on market conditions and other factors beyond our control, which may adversely affect the amount, timing or nature of our future offerings. As a result, holders of our Class A common stock bear the risk that our future offerings may reduce the market price of our Class A common stock and dilute their percentage ownership.

Future sales, or the perception of future sales, of our Class A common stock by us or our existing stockholders in the public market could cause the market price for our Class A common stock to decline.

The sale of substantial amounts of shares of our Class A common stock in the public market, or the perception that such sales could occur, could harm the prevailing market price of shares of our Class A common stock. These sales, or the possibility that these sales may occur, also might make it more difficult for us to sell equity securities in the future at a time and at a price that we deem appropriate.

In connection with the Business Combination, certain of our stockholders agreed that, subject to certain exceptions, they will not, during the period beginning at the effective time of the Business Combination and continuing to and including June 7, 2021, or the Restricted Period, directly or indirectly, offer, sell, contract to sell, pledge, grant any option to purchase, make any short sale or otherwise dispose of any shares of Class A common stock, or any options or warrants to purchase any shares of Class A common stock, or any securities convertible into, exchangeable for or that represent the right to receive shares of Class A common stock, or any interest in any of the foregoing.

In addition, pursuant to the terms of the Fourth Amended and Restated Investors’ Rights Agreement of Legacy Desktop Metal, as amended, the former preferred stockholders of Legacy Desktop Metal are prohibited, through June 7, 2021, from lending, offering, pledging, selling, contracting to sell, selling any option or contracting to purchase, purchasing any option or contracting to sell, granting any option, right, or warrant to purchase, or otherwise transferring or disposing of, directly or indirectly, any shares of Class A common stock or any securities convertible into or exercisable or exchangeable (directly or indirectly) for Class A common stock held immediately following the effective time of the Business Combination, or entering into any swap or other arrangement that transfers to another, in whole or in party, any of the economic consequences of ownership of such securities.

36

Table of Contents

Upon the expiration or waiver of the lock-ups described above, shares held by these stockholders will be eligible for resale, subject to, in the case of stockholders who are our affiliates, volume, manner of sale and other limitations under Rule 144 promulgated under the Securities Act.

In addition, in connection with the Business Combination, we amended and restated the registration rights agreement with certain of our stockholders pursuant to which we are obligated to register the stockholders’ shares of Class A common stock and shares of Class A common stock that the stockholders may acquire upon exercise of warrants or other rights to acquire Class A common stock. Those shares of Class A common stock have been registered pursuant to a Registration Statement on Form S-1 declared effective by the SEC on February 4, 2021 and are available for resale without restriction, subject to any lock-up agreement.

In addition, shares of our Class A common stock issuable upon exercise or vesting of incentive awards under our incentive plans are, once issued, eligible for sale in the public market, subject to any lock-up agreements and, in some cases, limitations on volume and manner of sale applicable to affiliates under Rule 144. Furthermore, shares of our Class A common stock reserved for future issuance under our 2020 Incentive Award Plan, or the 2020 Plan, including pursuant to the evergreen provision that allows our board of directors to reserve additional shares of Class A common stock for future issuance under the 2020 Plan each calendar year, may become available for sale in future.

The market price of shares of our Class A common stock could drop significantly if the holders of the shares described above sell them or are perceived by the market as intending to sell them. These factors could also make it more difficult for us to raise additional funds through future offerings of shares of our Class A common stock or other securities.

Our directors, executive officers and stockholders affiliated with our directors and executive officers own a significant percentage of our Class A common stock and, if they choose to act together, will be able to exert significant control over matters subject to shareholder approval.

Our directors, executive officers, and stockholders affiliated with our directors and executive officers exert significant influence on us. As of December 31, 2020, these holders owned approximately 60.9% of our outstanding Class A common stock. As a result, these holders, acting together, have significant control over all matters that require approval of our stockholders, including the election of directors, amendments of our organizational documents, or approval of any merger, sale of assets, or other major corporate transactions. The interests of these holders may not always coincide with our corporate interests or the interests of other stockholders, and they may act in a manner with which you may not agree or that may not be in the best interests of our other stockholders.

Anti-takeover provisions in our governing documents and under Delaware law could make an acquisition of us more difficult, limit attempts by our stockholders to replace or remove our current management and limit the market price of our Class A common stock.

Our certificate of incorporation, bylaws, and Delaware law contain provisions that could have the effect of rendering more difficult, delaying, or preventing an acquisition deemed undesirable by our board of directors. Among other things, our certificate of incorporation and bylaws include the following provisions:

a staggered board, which means that our board of directors is classified into three classes of directors with staggered three-year terms and directors are only able to be removed from office for cause;

limitations on convening special stockholder meetings, which could make it difficult for our stockholders to adopt desired governance changes;

a prohibition on stockholder action by written consent, which means that our stockholders will only be able to take action at a meeting of stockholders and will not be able to take action by written consent for any matter;

a forum selection clause, which means certain litigation against us can only be brought in Delaware;

the authorization of undesignated preferred stock, the terms of which may be established and shares of which may be issued without further action by our stockholders; and

37

Table of Contents

advance notice procedures, which apply for stockholders to nominate candidates for election as directors or to bring matters before an annual meeting of stockholders.

These provisions, alone or together, could delay or prevent hostile takeovers and changes in control or changes in our management. As a Delaware corporation, we are also subject to provisions of Delaware law, including Section 203 of the DGCL, which prevents interested stockholders, such as certain stockholders holding more than 15% of our outstanding Class A common stock, from engaging in certain business combinations unless (i) prior to the time such stockholder became an interested stockholder, our board of directors approved the transaction that resulted in such stockholder becoming an interested stockholder, (ii) upon consummation of the transaction that resulted in such stockholder becoming an interested stockholder, the interested stockholder owned at least 85% of our Class A common stock, or (iii) following board approval, such business combination receives the approval of the holders of at least two-thirds of our outstanding Class A common stock not held by such interested stockholder at an annual or special meeting of stockholders.

Any provision of our certificate of incorporation, our bylaws or Delaware law that has the effect of delaying, preventing or deterring a change in control could limit the opportunity for our stockholders to receive a premium for their shares of our Class A common stock and could also affect the price that some investors are willing to pay for our Class A common stock.

We are an “emerging growth company” and the reduced disclosure requirements applicable to emerging growth companies may make our Class A common stock less attractive to investors.

We are an “emerging growth company,” as defined in the JOBS Act. As an emerging growth company, we may follow reduced disclosure requirements and do not have to make all of the disclosures that public companies that are not emerging growth companies do. We will remain an emerging growth company until the earlier of (a) the last day of the fiscal year in which we have total annual gross revenues of $1.07 billion or more; (b) the last day of the fiscal year following the fifth anniversary of the date of the completion of the initial public offering of Trine; (c) the date on which we have issued more than $1 billion in nonconvertible debt during the previous three years; or (d) the date on which we are deemed to be a large accelerated filer under the rules of the SEC, which means the market value of our Class A common stock that is held by non-affiliates exceeds $700 million as of the prior June 30th. For so long as we remain an emerging growth company, we are permitted and intend to rely on exemptions from certain disclosure requirements that are applicable to other public companies that are not emerging growth companies. These exemptions include:

not being required to comply with the auditor attestation requirements of Section 404 of the Sarbanes-Oxley Act;

not being required to comply with any requirement that may be adopted by the Public Company Accounting Oversight Board regarding mandatory audit firm rotation or a supplement to the auditor’s report providing additional information about the audit and the financial statements (i.e., an auditor discussion and analysis);

reduced disclosure obligations regarding executive compensation in our periodic reports, proxy statements and registration statements; and

exemptions from the requirements of holding a nonbinding advisory vote of stockholders on executive compensation, stockholder approval of any golden parachute payments not previously approved and having to disclose the ratio of the compensation of our chief executive officer to the median compensation of our employees.

In addition, the JOBS Act provides that an emerging growth company can take advantage of an extended transition period for complying with new or revised accounting standards. This allows an emerging growth company to delay the adoption of certain accounting standards until those standards would otherwise apply to private companies. We have elected to use the extended transition period for complying with new or revised accounting standards; and as a result of this election, our financial statements may not be comparable to companies that comply with public company effective dates.

We may choose to take advantage of some, but not all, of the available exemptions for emerging growth companies. We cannot predict whether investors will find our Class A common stock less attractive if we rely on these exemptions. If some investors find our Class A common stock less attractive as a result, there may be a less active trading market for our Class A common stock and our share price may be more volatile.

38

Table of Contents

Our certificate of incorporation and bylaws provide that the Court of Chancery of the State of Delaware will be the sole and exclusive forum for substantially all disputes between us and our stockholders, which could limit our stockholders’ ability to obtain a favorable judicial forum for disputes with us or our directors, officers, or employees.

Our certificate of incorporation and bylaws provide that, unless we consent in writing to the selection of an alternative forum, the (a) Court of Chancery of the State of Delaware (or, in the event that the Chancery Court does not have jurisdiction, the federal district court for the District of Delaware or other state courts of the State of Delaware) shall, to the fullest extent permitted by law, be the sole and exclusive forum for: (i) any derivative action, suit or proceeding brought on our behalf; (ii) any action, suit or proceeding asserting a claim of breach of fiduciary duty owed by any of our directors, officers, or stockholders to us or to our stockholders; (iii) any action, suit or proceeding asserting a claim arising pursuant to the DGCL, our certificate of incorporation or bylaws; or (iv) any action, suit or proceeding asserting a claim governed by the internal affairs doctrine; and (b) subject to the foregoing, the federal district courts of the United States of America shall be the exclusive forum for the resolution of any complaint asserting a cause of action arising under the Securities Act. Notwithstanding the foregoing, such forum selection provisions shall not apply to suits brought to enforce any liability or duty created by the Exchange Act or any other claim for which the federal courts of the United States have exclusive jurisdiction. The choice of forum provision may limit a stockholder’s ability to bring a claim in a judicial forum that it finds favorable for disputes with us or our directors, officers, or other employees, which may discourage such lawsuits against us and our directors, officers, and other employees. Alternatively, if a court were to find the choice of forum provision contained in our certificate of incorporation to be inapplicable or unenforceable in an action, we may incur additional costs associated with resolving such action in other jurisdictions, which could harm our business, results of operations, and financial condition.

Additionally, Section 22 of the Securities Act creates concurrent jurisdiction for federal and state courts over all suits brought to enforce any duty or liability created by the Securities Act or the rules and regulations thereunder. As noted above, our certificate of incorporation and bylaws provide that the federal district courts of the United States of America shall have jurisdiction over any action arising under the Securities Act. Accordingly, there is uncertainty as to whether a court would enforce such provision. Our stockholders will not be deemed to have waived our compliance with the federal securities laws and the rules and regulations thereunder.

General Risk Factors

Our Class A common stock price may be volatile or may decline regardless of our operating performance. You may lose some or all of your investment.

The trading price of our Class A common stock is likely to be volatile. The stock market recently has experienced extreme volatility. This volatility often has been unrelated or disproportionate to the operating performance of particular companies. You may not be able to resell your shares at an attractive price due to a number of factors such as those listed in this section and the following:

the impact of the COVID-19 pandemic on our financial condition and the results of operations;

our operating and financial performance and prospects;

our quarterly or annual earnings or those of other companies in our industry compared to market expectations;

conditions that impact demand for our products;

future announcements concerning our business, our customers’ businesses or our competitors’ businesses;

the public’s reaction to our press releases, other public announcements and filings with the SEC;

the market’s reaction to our reduced disclosure and other requirements as a result of being an “emerging growth company” under the JOBS Act;

the size of our public float;

coverage by or changes in financial estimates by securities analysts or failure to meet their expectations;

39

Table of Contents

market and industry perception of our success, or lack thereof, in pursuing our growth strategy;

strategic actions by us or our competitors, such as acquisitions or restructurings;

changes in laws or regulations which adversely affect our industry or us;

changes in accounting standards, policies, guidance, interpretations or principles;

changes in senior management or key personnel;

issuances, exchanges or sales, or expected issuances, exchanges or sales of our capital stock;

changes in our dividend policy;

adverse resolution of new or pending litigation against us; and

changes in general market, economic and political conditions in the United States and global economies or financial markets, including those resulting from natural disasters, terrorist attacks, acts of war and responses to such events.

These broad market and industry factors may materially reduce the market price of our Class A common stock, regardless of our operating performance. In addition, price volatility may be greater if the public float and trading volume of our Class A common stock is low. As a result, you may suffer a loss on your investment.

In the past, following periods of market volatility, stockholders have instituted securities class action litigation. If we were involved in securities litigation, it could have a substantial cost and divert resources and the attention of executive management from our business regardless of the outcome of such litigation.

If securities analysts do not publish research or reports about us, or if they issue unfavorable commentary about us or our industry or downgrade our Class A common stock, the price of our Class A common stock could decline.

The trading market for our Class A common stock depends, in part, on the research and reports that third-party securities analysts publish about us and the industries in which we operate. We may be unable or slow to attract research coverage and if one or more analysts cease coverage of us, the price and trading volume of our securities would likely be negatively impacted. If any of the analysts that may cover us change their recommendation regarding our Class A common stock adversely, or provide more favorable relative recommendations about our competitors, the price of our Class A common stock would likely decline. If any analyst that may cover us ceases covering us or fails to regularly publish reports on us, we could lose visibility in the financial markets, which could cause the price or trading volume of our Class A common stock to decline. Moreover, if one or more of the analysts who cover us downgrades our Class A common stock, or if our reporting results do not meet their expectations, the market price of our Class A common stock could decline.

The obligations associated with being a public company involve significant expenses and require significant resources and management attention, which may divert from our business operations.

We are subject to the reporting requirements of the Exchange Act and the Sarbanes-Oxley Act. The Exchange Act requires that we file annual, quarterly and current reports with respect to our business and financial condition. The Sarbanes-Oxley Act requires, among other things, that we establish and maintain effective internal control over financial reporting. As a result, we will incur increased legal, accounting and other expenses that we did not previously incur. Our entire management team and many of our other employees will need to devote substantial time to compliance and may not effectively or efficiently manage our transition into a public company.

In addition, the need to establish the corporate infrastructure demanded of a public company may also divert management’s attention from implementing our business strategy, which could prevent us from improving our business, results of operations and financial condition. We have made, and will continue to make, changes to our internal control over financial reporting, including IT controls, and procedures for financial reporting and accounting systems to meet our reporting obligations as a public company.

40

Table of Contents

However, the measures we take may not be sufficient to satisfy our obligations as a public company. If we do not continue to develop and implement the right processes and tools to manage our changing enterprise and maintain our culture, our ability to compete successfully and achieve our business objectives could be impaired, which could negatively impact our business, financial condition and results of operations. In addition, we cannot predict or estimate the amount of additional costs we may incur to comply with these requirements. We anticipate that these costs will materially increase our general and administrative expenses.

These rules and regulations result in our incurring legal and financial compliance costs and will make some activities more time-consuming and costly. For example, we expect these rules and regulations to make it more difficult and more expensive for us to obtain director and officer liability insurance, and we may be required to accept reduced policy limits and coverage or incur substantially higher costs to obtain the same or similar coverage. As a result, it may be more difficult for us to attract and retain qualified people to serve on our board of directors, our board committees or as executive officers.

As a public reporting company, we will be subject to rules and regulations established from time to time by the SEC regarding our internal control over financial reporting. If we fail to establish and maintain effective internal control over financial reporting and disclosure controls and procedures, we may not be able to accurately report our financial results or report them in a timely manner.

We are subject to the rules and regulations established from time to time by the SEC and the NYSE. These rules and regulations require, among other things that we establish and periodically evaluate procedures with respect to our internal control over financial reporting. Reporting obligations as a public company are likely to place a considerable strain on our financial and management systems, processes and controls, as well as on our personnel.

In addition, as a public company, we are required to document and test our internal control over financial reporting pursuant to Section 404 of the Sarbanes-Oxley Act so that our management can certify as to the effectiveness of our internal control over financial reporting. For additional information related to the risks and uncertainties of our compliance with the Sarbanes-Oxley Act, see “— Risks Related to Our Business and Operations — Our internal controls over financial reporting currently do not meet all of the standards contemplated by Section 404 of Sarbanes-Oxley Act of 2002, or the Sarbanes-Oxley Act, and failure to achieve and maintain effective internal controls over financial reporting in accordance with Section 404 of the Sarbanes-Oxley Act could impair our ability to produce timely and accurate financial statements or comply with applicable regulations and have a material adverse effect on our business.

We are, and have been in the recent past, subject to litigation.

We are currently, and have been in the recent past, subject to litigation, and we could be subject to further litigation in the future. In 2018, we brought a claim in Massachusetts federal court against Markforged, Inc., or Markforged, a competitor in the additive manufacturing industry, regarding patent infringement and trade secret misappropriation. Markforged counterclaimed for trade secret misappropriation. We and Markforged entered into a confidential settlement agreement covering such matters in October 2018. In July 2019, Markforged brought a claim against us in Massachusetts federal court alleging false and misleading statements about their products in violation of the settlement agreement, which includes mutual non-disparagement and confidentiality obligations. The hearing was held in December 2020 and the arbitrator has ruled that we do not owe Markforged any damages associated with the claim.

While we intend to mount vigorous defenses to the above-described proceeding and any future lawsuits that may be brought against us by any third party, we can provide no assurance as to the outcome of any such disputes, and any such actions may result in judgments against us for significant damages. Resolution of any such matters can be prolonged and costly, and the ultimate results or judgments are uncertain due to the inherent uncertainty in litigation and other proceedings. In addition, the additive manufacturing industry has been, and may continue to be, litigious, particularly with respect to intellectual property claims. Moreover, our potential liabilities are subject to change over time due to new developments, changes in settlement strategy or the impact of evidentiary requirements. Regardless of the outcome, litigation has resulted in the past, and may result in the future, in significant legal expenses and require significant attention and resources of management. As a result, any present or future litigation that may be brought against us by any third party could result in losses, damages and expenses that have a significant adverse effect on our financial condition.

41

Table of Contents

We do not intend to pay dividends on our Class A common stock for the foreseeable future.

We currently intend to retain all available funds and any future earnings to fund the development and growth of our business. As a result, we do not anticipate declaring or paying any cash dividends on our Class A common stock in the foreseeable future. Any decision to declare and pay dividends in the future will be made at the discretion of our board of directors and will depend on, among other things, our business prospects, results of operations, financial condition, cash requirements and availability, certain restrictions related to our indebtedness, industry trends and other factors that our board of directors may deem relevant. Any such decision will also be subject to compliance with contractual restrictions and covenants in the agreements governing our current and future indebtedness. In addition, we may incur additional indebtedness, the terms of which may further restrict or prevent us from paying dividends on our Class A common stock. As a result, you may have to sell some or all of your Class A common stock after price appreciation in order to generate cash flow from your investment, which you may not be able to do. Our inability or decision not to pay dividends, particularly when others in our industry have elected to do so, could also adversely affect the market price of our Class A common stock.

Item 1B. Unresolved Staff Comments

None.

Item 2. Properties

Desktop Metal’s corporate offices are located at 63 3rd Avenue, Burlington, Massachusetts, where we occupy approximately 60,000 rentable square feet under a lease that expires in 2024. We use these facilities primarily for manufacturing, research and development, sales, marketing and administration. In addition to our corporate headquarters, we also lease two smaller properties in Burlington, Massachusetts for warehousing, research and development, and prototyping. We entered into a 3-year lease in 2019 for 5,000 square feet of space and a 2-year lease in 2019 for 2,000 square feet of space.

We believe the existing facilities are in good operating condition and adequate to meet our needs for the immediate future. We intend to procure additional space as we add employees and expand geographically, including internationally.

Item 3. Legal Proceedings

We are from time to time subject to various claims, lawsuits and other legal and administrative proceedings arising in the ordinary course of business. Some of these claims, lawsuits and other proceedings may involve highly complex issues that are subject to substantial uncertainties, and could result in damages, fines, penalties, non-monetary sanctions or relief. We recognize provisions for claims or pending litigation when we determine that an unfavorable outcome is probable and the amount of loss can be reasonably estimated. Due to the inherent uncertain nature of litigation, the ultimate outcome or actual cost of settlement may materially vary from estimates.

We were engaged in arbitration with Markforged, Inc., a competitor in the 3D printing industry, regarding claims against us alleging false and misleading statements about their products in violation of a settlement agreement that we entered into with Markforged, Inc. to settle a prior dispute regarding patent infringement and trade secret misappropriation. The hearing was held in December 2020 and the arbitrator has ruled that that the Company does not owe Markforged any damages in association with the claim. See Note 15 to the consolidated financial statements included elsewhere in this Annual Report on Form 10-K for additional information.

Item 4. Mine Safety Disclosures

Not applicable.

42

Table of Contents

PART II

Item 5. Market for Registrant’s Common Equity, Related Stockholder Matters and Issuer Purchases of Equity Securities

Market Information

Our Class A common stock and warrants are listed on the New York Stock Exchange under the symbols “DM” and “DM.WS”, respectively.

Stockholders

As of March 10, 2021, there were 218 holders of record of our Class A common stock and one holder of record of our warrants. The actual number of stockholders of our Class A common stock and the actual number of holders of our warrants is greater than the number of record holders and includes stockholders of our warrants whose Class A common stock or warrants are held in street name by brokers and other nominees.

Dividend Policy

We have never declared or paid cash dividends on our capital stock. We do not expect to pay dividends on our capital stock for the foreseeable future, instead anticipating that all of our earnings for the foreseeable future will be used for the operation and growth of our business. The payment of any future dividends will be at the discretion of our board of directors and will depend on various factors, including our operating results, financial condition, capital requirements, growth plans, any contractual and legal restrictions on our payment of dividends, and any other factors deemed relevant by our board of directors.

Recent Sales of Unregistered Securities

All sales of unregistered securities by us during the year ended December 31, 2020 have been included previously in a Quarterly Report on Form 10-Q or in a Current Report on Form 8-K.

Issuer Purchases of Equity Securities

The following table sets forth purchases of our common stock for the three months ended December 31, 2020:

Period

Total number of shares purchased (1)

Average price paid per share

Total number of shares purchased as part of a publicly announced program

Approximate dollar value of shares that may yet be purchased under the program

October 1, 2020 through October 31, 2020

$

November 1, 2020 through November 30, 2020

$

December 1, 2020 through December 31, 2020

9,308

$

10.90

Total

9,308

(1) All of the shares were withheld from employees in satisfaction of minimum tax withholding obligations associated with the issuance of shares of Class A common stock in connection with acquisitions during the period.

Item 6. Selected Financial Data

Not applicable.

43

Table of Contents

Item 7. Management’s Discussion and Analysis of Financial Condition and Results of Operations

The following discussion and analysis provides information which management believes is relevant to an assessment and understanding of Desktop Metal’s consolidated results of operations and financial condition. The discussion should be read in conjunction with Desktop Metal’s consolidated financial statements and notes thereto included elsewhere in Annual Report on Form 10-K. This discussion contains forward-looking statements and involves numerous risks and uncertainties, including, but not limited to, those described under the heading “Risk Factors”. Actual results may differ materially from those contained in any forward-looking statements.

Business Overview

Desktop Metal is pioneering a new generation of additive manufacturing technologies focused on the production of end-use parts. We offer a portfolio of integrated additive manufacturing solutions for engineers, designers and manufacturers comprised of hardware, software, materials, and services. Our solutions span use cases across the product life cycle, from product development to mass production and aftermarket operations, and they address an array of industries, including automotive, aerospace, healthcare, consumer products, heavy industry, machine design and research and development.

Our growth strategy begins with a commitment to research and development. Since our founding in 2015, we have invested significant resources in research and development, including $43.1 million in 2020, towards building an extensive portfolio of proprietary and differentiated technologies with a focus on making additive manufacturing an easy-to-use, economic and scalable solution. Our additive manufacturing products, which incorporate these technologies, offer several key advantages over competitive additive manufacturing technologies and provide our customers with several price points depending on their desired features and applications. Our announced additive manufacturing platforms are as follows:

Production System is an industrial manufacturing platform powered by our proprietary SPJ technology, which is designed to achieve speeds up to 100 times those of legacy Powder Bed Fusion (PBF) additive manufacturing technologies and enable production quantities of up to millions of parts per year at part costs competitive with conventional mass production techniques. The Production System platform consists of two printer models. The P-1, which began commercial shipments in the fourth quarter of 2020, is a small form factor solution for process development and serial production applications. The P-50, which is scheduled to begin commercial shipments in 2021, is a large form factor mass production solution for end-use parts.

Shop System is an affordable, turnkey binder jetting platform designed to bring metal 3D printing to machine and job shops, leveraging build rates up to 10 times those of legacy PBF additive manufacturing technologies in combination with our proprietary sintering technology to enable serial production of dense metal parts with exceptional surface finish and rich feature detail. Shop System began commercial shipments in the fourth quarter of 2020.

Studio System is designed for office-friendly metal 3D printing and leverages our proprietary BMD technology to minimize requirements for special facilities as compared to legacy PBF additive manufacturing technologies and simplify the production of low volumes of complex, high quality metal parts in-house. Studio System has been shipping in volume since the fourth quarter of 2018, and in February 2020, we announced a second-generation platform, Studio System 2, which further streamlines the BMD process.

Fiber is a desktop 3D printer that incorporates our proprietary Micro AFP technology and is designed to produce high-resolution composite parts reinforced with aerospace- and industrial-grade continuous fiber tape, unlocking superior part strength with high-performance materials starting at an affordable annual subscription price. Fiber began initial commercial shipments in the fourth quarter of 2020.

44

Table of Contents

Operating Results

For the year ended December 31, 2020, we recognized revenues of $16.5 million and used cash in operating activities of $80.6 million, and we ended the year with $595.4 million of cash, cash equivalents, and short-term investments. We incurred a net loss of $90.4 million for the year ended December 31, 2020. In December 2020, we completed the Business Combination, receiving $534.6 million net cash proceeds, which we expect to support our operations and investments in the near term.

Recent Developments

Trine Merger

On December 9, 2020, we consummated the Business Combination. Cash proceeds of the Business Combination were funded through a combination of Trine’s $305 million of cash held in trust, net of redemptions of $0.3 million, and an aggregate of $275 million in gross proceeds to us from the sale of shares of our Class A common stock in a private placement in connection with the Business Combination, or the PIPE financing. Our cash on hand after giving effect to these transactions will be used for general corporate purposes, including advancement of our product development efforts. We also intend to use the proceeds to acquire other companies or technologies in the additive manufacturing industry.

The Business Combination was accounted for as a reverse recapitalization. Legacy Desktop Metal has been determined to be the accounting acquirer based on the following facts and circumstances:

Legacy Desktop Metal’s shareholders have majority of the voting power in Desktop Metal;

Legacy Desktop Metal has the ability to appoint a majority of the board of directors of Desktop Metal;

Legacy Desktop Metal’s existing management comprises the management of Desktop Metal;

Legacy Desktop Metal comprises the ongoing operations of Desktop Metal;

Legacy Desktop Metal is the larger entity based on historical revenues and business operations; and

Desktop Metal assumed Legacy Desktop Metal’s name.

Under this method of accounting, Trine is treated as the “acquired” company for financial reporting purposes. Accordingly, for accounting purposes, the Business Combination is treated as the equivalent of Legacy Desktop Metal issuing stock for the net assets of Trine, accompanied by a recapitalization, and the historical financial statements of Legacy Desktop Metal became the historical financial statements of our company upon the closing of the Business Combination.

EnvisionTEC Acquisition

On February 16, 2021, pursuant to the Purchase Agreement and Plan of Merger dated January 14, 2021, we consummated the EnvisionTEC Acquisition. The Company paid consideration of $143.8 million in cash and issued 5,036,142 Class A common shares with a fair value of $159.8 million as of the close of business on the acquisition date. In connection with the transaction, the Company also agreed to grant restricted stock units totaling 475,848 shares of Class A common stock to key EnvisionTEC employees.

COVID-19

In March 2020, the World Health Organization declared the outbreak of COVID-19 a pandemic. It is not possible to accurately predict the full impact of the COVID-19 pandemic on our business, financial condition and results of operations due to the evolving nature of the COVID-19 pandemic and the extent of its impact across industries and geographies and numerous other uncertainties. For example, we face uncertainties about the duration and spread of the outbreak, additional actions that may be taken by governmental entities, and the impact it may have on the ability of us, our customers, our suppliers, our manufacturers and our other business partners to conduct business. Governments in affected regions have implemented, and may continue to implement, safety precautions which include quarantines, travel restrictions, business closures, cancellations of public gatherings and other measures as

45

Table of Contents

they deem necessary. Many organizations and individuals, including our company and employees, are taking additional steps to avoid or reduce infections, including limiting travel and staying home from work. These measures are disrupting normal business operations and have had significant negative impacts on businesses and financial markets worldwide. We continue to monitor our operations and government recommendations and have made modifications to our normal operations because of the COVID-19 pandemic, including requiring most non-engineering or operations-related team members to work remotely, utilizing heightened cleaning and sanitization procedures, implementing new health and safety protocols and reducing non-essential travel.

The COVID-19 pandemic has caused us to experience several adverse impacts, including extended sales cycles to close new orders for our products, delays in shipping and installing orders due to closed facilities and travel limitations and delays in collecting accounts receivable. The rapid development and uncertainty of the impacts of the COVID-19 pandemic precludes any prediction as to the ultimate adverse impact of the COVID-19 pandemic on our business. However, the COVID-19 pandemic, and the measures taken to contain it, present material uncertainty and risk with respect to our performance and financial results. In particular, businesses across an array of vertical markets are temporarily reducing capital expenditure budgets globally as they seek to preserve liquidity to ensure the longevity of their own operations, which in turn may lead to reductions in purchases of our additive manufacturing solutions. Further, office closures may prevent organizations from reaching typical utilizations of our additive manufacturing solutions, resulting in reductions in purchases of consumable materials. Additionally, the COVID-19 pandemic may contribute to facility closures at our third-party contract manufacturers and key suppliers, causing delays and disruptions in product manufacturing, which could affect our ability to ship products purchased by our customers in a timely manner. Disruptions in the capital markets as a result of the COVID-19 pandemic may also adversely affect our business if these impacts continue for a prolonged period and we need additional liquidity.

In the short-term, we have taken, and will continue to take, actions to mitigate the impact of the COVID-19 pandemic on our cash flow and results of operations and financial condition. We are managing the variable portion of our cost structure to better align with revenue, including external marketing spend, which will be significantly reduced during this period of disruption. Similarly, we have reduced discretionary research and development spending and plan to continue to closely manage additional spend. Additionally, we have reduced staffing across the organization by 30% across all departments. In the long-term, we believe that the COVID-19 pandemic will encourage organizations to reassess their supply chain structure and may accelerate their adoption of solutions such as additive manufacturing, which could allow for greater flexibility and a reduced reliance on overseas manufacturing.

Key Factors Affecting Operating Results

We believe that our performance and future success depend on many factors that present significant opportunities for us but also pose risks and challenges, including those discussed below and in “Risk Factors” section of this Annual Report on Form 10-K.

Commercial Launch of Products

Several of our products began commercial shipments in late 2020, with more in the late stages of development and scheduled to begin commercial shipments in 2021. Prior to commercialization, we must complete final testing and manufacturing ramp-up of these products at our third-party contract manufacturers. Any delays in successful completion of these steps may impact our ability to generate revenue from these products.

Adoption of our Additive Manufacturing Solutions

We believe the world is at an inflection point in the adoption of additive manufacturing solutions and that we are well-positioned to take advantage of this opportunity across an array of industries due to our proprietary technologies and global distribution capabilities. We expect that our results of operations, including revenue and gross margins, will fluctuate for the foreseeable future as businesses continue to shift away from conventional manufacturing processes towards additive manufacturing for end-use parts. Our turnkey and volume production solutions are designed to empower businesses to realize the full benefits of additive manufacturing at-scale, including geometric and design flexibility, mass customization and supply chain engineering, among others. The degree to which potential and current customers recognize these benefits and invest in our solutions will affect our financial results.

46

Table of Contents

Pricing, Product Cost and Margins

While most of our revenue to date has been generated by sales of our Studio System, we began commercial shipments of several previously announced products in late 2020, which offer customers a range of additive manufacturing solutions spanning multiple price points, materials, throughput levels, operating environments and technologies to enable them to find the solution that achieves their specific goals. We also expect to commercialize additional previously announced products over the course of 2021. Pricing for these products may vary by region due to market-specific supply and demand dynamics and product lifecycles, and sales of certain products have, or are expected to have, higher gross margins than others. As a result, our financial performance depends, in part, on the mix of products we sell during a given period. In addition, we are subject to price competition, and our ability to compete in key markets will depend on the success of our investments in new technologies and cost improvements as well as our ability to efficiently and reliability introduce cost-effective additive manufacturing solutions for our customers.

Continued Investment and Innovation

We believe that we are a leader in mass production and turnkey additive manufacturing solutions, offering breakthrough technologies that enable high throughput and ease-of-use through our broad product portfolio. Our performance is significantly dependent on the investment we make in our research and development efforts and on our ability to be at the forefront of the additive manufacturing industry. It is essential that we continually identify and respond to rapidly evolving customer requirements, develop and introduce innovative new products, enhance existing products and generate customer demand for our solutions. We believe that investment in our additive manufacturing solutions will contribute to long-term revenue growth, but it may adversely affect our near-term profitability.

Components of Results of Operations

Revenue

The majority of our revenue results from the sales of products, including our additive manufacturing systems and embedded on-device software and related consumables. Product revenue is recognized upon transfer of control to the customer, which generally takes place at the point of shipment. We also generate a portion of our revenue from software and support services. Software revenue is recognized (i) in the case of on-device software, upon transfer of control to the customer, which generally takes place upon shipment, and (ii) in the case of cloud-based software, which is primarily sold through one-year annual contracts, ratably over the term of the agreement. Revenue from support services for our additive manufacturing systems is primarily generated through one-year annual contracts and is recognized ratably over the term of the agreement.

We generate revenue and deliver products and services principally through sales to resellers, who purchase and resell our products and also provide installation and support services for our additive manufacturing solutions to end-users. Occasionally and for certain products (and related consumables, software and support services), we generate revenue from and deliver services to our customers directly.

Cost of Revenue

Our cost of revenue consists of the cost of products and cost of services. Cost of products includes the manufacturing cost of our additive manufacturing systems and consumables, which primarily consists of amounts paid to our third-party contract manufacturers and suppliers and personnel-related costs directly associated with manufacturing operations. Cost of services includes personnel-related costs directly associated with the provision of support services to our customers, which include engineers dedicated to remote support as well as, training, support and the associated travel costs. Our cost of revenues also includes depreciation and amortization, cost of spare or replacement parts, warranty costs, excess and obsolete inventory and shipping costs, and an allocated portion of overhead costs. We expect cost of revenue to increase in absolute dollars in future periods as we expect our revenues to continue to grow.

47

Table of Contents

Gross Profit and Gross Margin

Our gross profit is calculated based on the difference between our revenues and cost of revenues. Gross margin is the percentage obtained by dividing gross profit by our revenue. Our gross profit and gross margin are, or may be, influenced by a number of factors, including:

Market conditions that may impact our pricing;
Product mix changes between established products and new products;
Growth in our installed customer base or changes in customer utilization of our additive manufacturing systems, which affects sales of our consumable materials and may result in excess or obsolete inventories; and
Our cost structure for manufacturing operations, including contract manufacturers, relative to volume, and our product support obligations.

We expect our gross margins to fluctuate over time, depending on the factors described above.

Research and Development

Our research and development expenses represent costs incurred to support activities that advance the development of innovative additive manufacturing technologies, new product platforms and consumables, as well as activities that enhance the capabilities of our existing product platforms. Our research and development expenses consist primarily of employee-related personnel expenses, prototypes, design expenses, consulting and contractor costs and an allocated portion of overhead costs. We expect research and development costs will increase on an absolute dollar basis over time as we continue to invest in advancing our portfolio of additive manufacturing solutions.

Sales and Marketing

Sales and marketing expenses consist primarily of employee-related costs for individuals working in our sales and marketing departments, third party commissions, costs related to trade shows and events and an allocated portion of overhead costs. We expect our sales and marketing costs will increase on an absolute dollar basis as we expand our headcount, initiate new marketing campaigns and launch new product platforms.

General and Administrative

General and administrative expenses consist primarily of personnel-related expenses associated with our executive, finance, legal, information technology and human resources functions, as well as professional fees for legal, audit, accounting and other consulting services, and an allocated portion of overhead costs. We expect our general and administrative expenses will increase on an absolute dollar basis as a result of operating as a public company, including expenses necessary to comply with the rules and regulations applicable to companies listed on a national securities exchange and related to compliance and reporting obligations pursuant to the rules and regulations of the SEC, as well as increased expenses for general and director and officer insurance, investor relations, and other administrative and professional services. In addition, we expect to incur additional costs as we hire additional personnel and enhance our infrastructure to support the anticipated growth of the business.

Interest Expense

Interest expense includes cash interest related to our term loan as well as amortization of deferred financing fees and costs.

Interest and Other Income, Net

Interest and other income, net includes interest earned on deposits and short-term investments and gains and losses on investments.

48

Table of Contents

Income Taxes

Our income tax provision consists of an estimate for U.S. federal and state and foreign income taxes based on enacted rates, as adjusted for allowable credits, deductions, uncertain tax positions, changes in deferred tax assets and liabilities and changes in tax law. Due to cumulative losses, we maintain a valuation allowance against our U.S., state and foreign deferred tax assets. We recognized an income tax benefit of $0.9 million related to the acquisition of acquired technology.

Results of Operations

Comparison of the years ended December 31, 2020 and 2019

Revenue

The following table presents the revenue of each of our revenue streams, as well as the percentage of total revenue and change from the prior year.

For the Years Ended December 31, 


2020


2019


Change in Revenues


(Dollars in thousands)

Revenue


% of Total


Revenue


% of Total


$


%


Product Revenue

$

13,718

83

%  

$

22,758

86

%  

$

(9,040)

(40)

%

Service Revenue

2,752


17

%  

3,681


14

%  


(929)

(25)

%

Total Revenue

$

16,470


100

%  

$

26,439


100

%  

$

(9,969)

(38)

%

Total revenue for the years ended years ended December 31, 2020 and 2019 was $16.5 million and $26.4 million, respectively, a decrease of $9.9 million, or 38%. The decrease in total revenue was attributable to a decrease in revenue from both products and services.

We sold fewer products during the year ended December 31, 2020 as compared to the year ended December 31, 2019, leading to an approximately 40% decrease in product revenue. This was primarily due to decreased customer demand and longer sales cycles resulting from the COVID-19 pandemic. Additionally, as a result of customer facilities closures associated with the COVID-19 pandemic, we experienced delays in shipments and installation as well as decreased utilization of our installed products, leading to a decrease in sales of consumable materials.

Service revenue decreased during the year ended December 31, 2020, as compared to the year ended December 31, 2019, primarily due to a decrease in support and installation revenue from decreased shipments during the period.

The following table presents revenue by geographic region, as well as the percentage of total revenue and change from the prior period.

For the Years Ended December 31, 


2020


2019


Change in Revenues


(Dollars in thousands)

Revenue


% of Total


Revenue


% of Total


$


%

Americas

$

6,665

40

%

$

15,801

60

%

$

(9,136)

(58)

%

EMEA (Europe, the Middle East and Africa)

7,788


47

%

8,993


34

%


(1,205)

(13)

%

APAC (Asia‑Pacific)

2,017


12

%

1,645


6

%


372

23

%

Total Revenue

$

16,470


100

%

$

26,439


100

%

$

(9,969)

(38)

%

Total revenue decreased due to fewer product sales in the Americas and EMEA regions driven by decreased customer demand resulting from the COVID-19 pandemic. This decrease was partially offset by increased sales in the APAC region, driven primarily by an improvement in hardware product volume sold in the region during the year ended December 31, 2020.

49

Table of Contents

Cost of Sales

Total cost of sales during the years ended years ended December 31, 2020 and 2019 was $31.5 million and $50.8 million, respectively, a decrease of $19.3 million or 38%. The decrease in total cost of sales was driven primarily by a decrease in product cost of sales, which resulted from fewer product sales. This decrease was partially offset by an increase to our inventory reserves. During 2020, we recognized a $2.9 million obsolescence inventory charge related to product redesigns implemented to reduce costs and enhance performance and functionality.

Gross Loss and Gross Margin

The following table presents gross loss by revenue stream, as well as change in gross loss dollars from the prior period.

For the


Years Ended


December 31, 

Change in Gross


2020


2019

Loss


(Dollars in thousands)

Gross Loss


$

%

Products

$

(13,227)

$

(22,510)

$

9,283

41

%

Services


(1,822)


(1,847)


25

1

%

Total

$

(15,049)

$

(24,357)

$

9,308

38

%

Total gross loss during the years ended December 31, 2020 and 2019 was $15.0 million and $24.4 million, respectively. The decrease in gross loss of $9.3 million is driven by the fact that we sold less units during the year ended December 31, 2020, as compared to the year ended December 31, 2019. Negative gross profit during these periods was the result of higher system costs than selling price, primarily driven by a combination of small purchase quantities for systems and consumables from our third-party contract manufacturers, resulting in higher costs, and the selection of suppliers influenced by time-to-market considerations instead of just cost considerations.

The following table presents gross margin by revenue stream, as well as the change in gross margin from the prior period.

For the Years


Ended

Change in Gross


December 31, 

 Margin


2020

2019

Percentage

(Dollars in thousands)

Gross Margin

 Points

%


Products

(96)

%  

(99)

%  

0.03


3

%

Services

(66)

%  

(50)

%  

(0.16)


(32)

%

Total

(91)

%  

(92)

%  

0.01


1

%

Total gross margin for the years ended December 31, 2020, and 2019 was (91)% and (92)%, respectively. The increase in total gross margin was primarily due to the increase in gross margin from our product revenue, which resulted from a lower product cost for units shipped in 2020 as compared to 2019. This was partially offset by an obsolescence inventory charge related to product redesigns implemented to reduce costs and enhance performance and functionality.

Research and Development

Research and development expenses during the years ended December 31, 2020 and 2019 were $43.1 million and $54.7 million, respectively, a decrease of $11.6 million, or 21%. The decrease in research and development expenses was primarily due to a $5.0 million decrease in prototyping costs related to the maturation of our product development efforts. Additionally, during the year ended December 31, 2020, we reduced engineering consulting expenses and headcount to mitigate the impacts and uncertainties around COVID-19 as described in the “Recent Developments” section above, resulting in savings of $3.9 million $3.2 million, respectively. These expense reductions were partially offset by common stock warrant expense associated with product development of $1.7 million.

50

Table of Contents

Sales and Marketing

Sales and marketing expenses during the years ended years ended December 31, 2020 and 2019 were $13.1 million and $18.8 million, respectively, a decrease of $5.7 million, or 30%. The decrease in sales and marketing expenses was primarily due to a reduction tradeshow and related travel expenses and marketing headcount during the year ended December 31, 2020 to mitigate the impacts of, and uncertainties around, the COVID-19 pandemic as described in the “Recent Developments” section above, resulting in savings of $2.0 million and $0.9 million, respectively. During the year ended December 31, 2020, there was a decrease in third party commissions of $1.0 million resulting from our shift towards a reseller model for our distribution network, as compared to the prior sales agent model.

General and Administrative

General and administrative expenses during the years ended December 31, 2020 and 2019 were $20.7 million and $11.3 million, respectively, an increase of $9.4 million, or 83%. The increase in general and administrative expenses was primarily due to an increase of $5.4 million of professional fees incurred as a result of the Business Combination and costs related to operating as a public company, $2.5 million increase in compensation costs related to the modification of certain equity based awards and $0.6 increase in compensation costs, related to hiring to support public company requirements.

Interest Expense

Interest expense during the years ended December 31, 2020 and 2019 was $0.3 million and $0.5 million, respectively, a decrease of $0.2 million, or 40%. The decrease resulted from a decrease in the variable interest rate paid on our term loan.

Interest and Other Income, Net

Interest and other income, net during the years ended December 31, 2020 and 2019 and was $1.0 million and $6.0 million, respectively, a decrease of $5.0 million, or 83%. Interest income decreased primarily due to a decrease in cash available for investment.

Income Taxes

We recorded an income tax benefit during the year ended December 31, 2020 compared to no provision for the year ended December 31, 2019. The increase was due to the acquisition of acquired technology treated as a stock acquisition for tax purposes and an asset acquisition in accordance with GAAP.

We have provided a valuation allowance for all of our deferred tax assets as a result of our historical net losses in the jurisdictions in which we operate. We continue to assess our future taxable income by jurisdiction based on our recent historical operating results, the expected timing of reversal of temporary differences, various tax planning strategies that we may be able to enact in future periods, the impact of potential operating changes on our business and our forecast results from operations in future periods based on available information at the end of each reporting period. To the extent that we are able to reach the conclusion that deferred tax assets are realizable based on any combination of the above factors in a single, or multiple, taxing jurisdictions, a reversal of the related portion of our existing valuation allowances may occur.

Non-GAAP Financial Information

In addition to our results determined in accordance with GAAP, we believe that EBITDA and Adjusted EBITDA, each non-GAAP financial measures, are useful in evaluating our operational performance. We use this non-GAAP financial information to evaluate our ongoing operations and for internal planning and forecasting purposes. We believe that this non-GAAP financial information, when taken collectively, may be helpful to investors in assessing our operating performance.

We define “EBITDA” as net loss plus net interest income, provision for income taxes, depreciation and amortization expense.

We define “Adjusted EBITDA” as EBITDA adjusted for stock-based compensation and warrants.

51

Table of Contents

We believe that the use of EBITDA and Adjusted EBITDA provides an additional tool for investors to use in evaluating ongoing operating results and trends because it eliminates the effect of financing, capital expenditures, and non-cash expenses such as stock-based compensation and warrants, and provides investors with a means to compare our financial measures with those of comparable companies, which may present similar non-GAAP financial measures to investors. However, you should be aware that when evaluating EBITDA and Adjusted EBITDA we may incur future expenses similar to those excluded when calculating these measures. In addition, our presentation of these measures should not be construed as an inference that our future results will be unaffected by unusual or non-recurring items. Our computation of these measures, especially Adjusted EBITDA, may not be comparable to other similarly titled measures computed by other companies because not all companies calculate these measures in the same fashion.

Because of these limitations, EBITDA and Adjusted EBITDA should not be considered in isolation or as a substitute for performance measures calculated in accordance with GAAP. We compensate for these limitations by relying primarily on our GAAP results and using EBITDA and Adjusted EBITDA on a supplemental basis. You should review the reconciliation of net loss to EBITDA and Adjusted EBITDA below and not rely on any single financial measure to evaluate our business.

The following table reconciles net loss to EBITDA and Adjusted EBITDA during the years ended years ended December 31, 2020 and 2019, respectively:

For the Years Ended 

December 31, 

(Dollars in thousands)

2020


2019

Net loss attributable to common stockholders

$

(90,432)

$

(103,596)

Interest (income) expense, net


(610)


(3,993)

Income tax benefit


(940)


Depreciation and amortization


8,589


8,087

EBITDA


(83,393)


(99,502)

Stock compensation expense


8,006


5,215

Warrant expense

1,915

1,038

Adjusted EBITDA

$

(73,472)

$

(93,249)

Liquidity and Capital Resources

We have incurred a net loss in each of our annual periods since our inception. We incurred net losses of $90.4 million and $103.6 million during the years ended December 31, 2020 and 2019, respectively. As of December 31, 2020, we had $595.4 million in cash, cash equivalents, and short-term investments. As noted in the “Recent Developments” section above, we completed the Business Combination. We received $534.6 million net cash proceeds as a result of the transaction which we expect to support our operations and investments in the near term.

Since inception, we have received cumulative net proceeds from the Business Combination and the sale of our preferred and common stock of $973.4 million to fund our operations. As of December 31, 2020, our principal sources of liquidity were our cash, cash equivalents, and short-term investments of $595.4 million which are principally invested in money market funds and fixed income instruments.

In June 2018, we entered into a three-year, $20.0 million term loan, which provided $10.0 million immediately with the remaining principal balance available to be drawn in up to three draws of not less than $2.0 million for 12 months from close of the facility. We entered into this loan to fund capital expenditures associated with our corporate office. Interest is calculated using the Wall Street Journal Prime rate less 50 basis points, payable monthly in arrears. If our cash and investments fall below $30.0 million, cash equal to the total outstanding amount of the debt is required to be placed in a money market account. In connection with this loan, we are also subject to periodic reporting requirements, and the lender has a first priority lien on all assets. Repayment terms include interest only payments for 36 months, with the principal coming due in June 2021.

In April 2020, we received loan proceeds in the amount of approximately $5.4 million under the Paycheck Protection Program, or the “PPP”). The PPP, established as part of the Coronavirus Aid, Relief and Economic Security Act, provides for loans to qualifying businesses. We repaid the loan in its entirety on May 13, 2020.

52

Table of Contents

We believe that our existing capital resources will be sufficient to support our operating plan and cash commitments for at least the next 12 months. As of December 31, 2020, we had $483.5 million in cash and cash equivalents, and $111.9 million in short-term liquid investments. This liquid asset balance significantly exceeds our current liabilities of $30.5 million as of the same date. If we anticipate that our actual results will differ from our operating plan, we believe we have sufficient capabilities to enact cost savings measures to preserve capital.

We expect net losses to continue in connection with our ongoing activities, particularly as we continue to invest in commercialization and new product development. Additionally, we may engage in future acquisitions which may require additional capital.

Cash Flows

Since inception, we have primarily used proceeds from the Business Combination, issuances of preferred stock and debt instruments to fund our operations. The following table sets forth a summary of cash flows for the periods presented:

For the Years Ended 

December 31, 

(Dollars in thousands)


2020


2019

Net cash used in operating activities

$

(80,575)

$

(97,202)

Net cash used in investing activities

(36,983)


(26,032)

Net cash provided by financing activities

534,922


160,352

Net change in cash, cash equivalents, and restricted cash

$

417,364

$

37,118

Cash Flows for the years ended December 31, 2020 and 2019

Operating Activities

Net cash used in operating activities was $80.6 million for the year ended December 31, 2020, primarily consisting of $90.4 million of net losses, adjusted for non-cash items, which primarily included depreciation and amortization expense of $8.5 million, stock-based compensation expense of $8.0 million, and warrant expense of $1.9 million, as well as a $7.9 million increase in cash consumed by working capital. The increase in cash consumed by working capital was primarily driven by an increase in certain assets including accounts receivable and inventory alongside a decrease in certain liabilities including accounts payable. This increase in cash consumed by working capital was partially offset by an increase in certain liabilities including accrued expenses and other current liabilities and customer deposits.

Net cash used in operating activities was $97.2 million for the year ended December 31, 2019, primarily consisting of $103.6 million of net losses, adjusted for certain non-cash items, which primarily included depreciation and amortization expense of $8.1 million and stock-based compensation expense of $5.2 million, as well as a $5.3 million increase in cash consumed by working capital. The increase in cash consumed by working capital was primarily driven by an increase in certain assets including accounts receivable and inventory alongside a decrease in certain liabilities including accounts payable and deferred revenue. This increase in cash consumed by working capital was partially offset by an increase in certain liabilities including accrued expenses and other current liabilities.

The majority of our inventory consists of finished goods. Inventory balances may fluctuate during cycles of new product launch, commercialization and planned growth of production and sales of products.

Investing Activities

Net cash used in investing activities was $37 million for the year ended December 31, 2020, primarily consisting of purchases of marketable securities of $136.3 million, offset by proceeds from sales and maturities of marketable securities of $109.0 million. We also paid cash to acquire two companies, made an investment in a privately held company in the form of convertible debt in the amount of $3.0 million, and purchased $1.4 million of property and equipment.

53

Table of Contents

Net cash used in investing activities was $26.0 million for the year ended December 31, 2019, primarily consisting of purchases of marketable securities of $215.6 million, offset by proceeds from sales and maturities of marketable securities of $196.8 million, as well as purchases of property and equipment for $6.9 million.

Financing Activities

Net cash provided by financing activities was $534.9 million for the year ended December 31, 2020, consisting primarily of proceeds from the Business Combination and PIPE financing.

Net cash provided by financing activities was $160.4 million for the year ended December 31, 2019, consisting primarily of proceeds from the issuance of preferred stock.

Off-Balance Sheet Arrangements

We have no off-balance sheet arrangements and do not utilize any “structured debt,” “special purpose” or similar unconsolidated entities for liquidity or financing purposes.

Critical Accounting Policies and Significant Estimates

Our discussion and analysis of financial condition and results of operations are based upon our consolidated financial statements, which have been prepared in accordance with accounting principles generally accepted in the United States. Certain of our accounting policies require the application of judgment in selecting the appropriate assumptions for calculating financial estimates. By their nature, these judgments are subject to an inherent degree of uncertainty. We periodically evaluate the judgments and estimates used for our critical accounting policies to ensure that such judgments and estimates are reasonable for our interim and year-end reporting requirements. These judgments and estimates are based on our historical experience (where available), current trends and information available from other sources, as appropriate. If different conditions result from those assumptions used in our judgments, the results could be materially different from our estimates. We believe the following critical accounting policy requires significant judgments and estimates in the preparation of our consolidated financial statements:

Revenue Recognition

We recognize revenue from sale of products upon transfer of control, which is generally at the point of shipment. Revenue from sale of services may be recognized over the life of the associated service contract or as services are performed, depending on the nature of the services being provided.

Our contracts with customers often include promises to transfer multiple products and services to the customer. Judgment is required to determine the separate performance obligations present in a given contract, which we have concluded are generally capable of being distinct and accounted for as separate performance obligations. We use standalone selling price, or SSP, to allocate revenue to each performance obligation. Significant judgment is required to determine the SSP for each distinct performance obligation in a contract.

We began generating revenue in the fourth quarter of 2018, and as such, we have had limited standalone sales of our products and services. The absence of observable prices resulting from our relatively short period of revenue generation requires us to estimate the SSPs of distinct performance obligations in a given contract.

We determine SSP using market conditions and other observable inputs. We typically have more than one SSP for individual products and services due to the stratification of our customers. The SSP generally varies by size of the customer. Our determination of SSP may change in the future as standalone sales of products and services occur, providing observable prices.

Stock-Based Compensation

We have applied the fair value recognition provisions of Financial Accounting Standards Board, or FASB, Accounting Standards Codification, or ASC, Topic 718 Compensation-Stock Compensation to account for the stock-based compensation for employees and non-employees. We recognize compensation costs related to stock options granted to employees and non-employees based on

54

Table of Contents

estimated fair value of the award on the date of grant. Described below is the methodology we have utilized in measuring stock-based compensation expense.

Determining the amount of stock-based compensation to be recorded requires us to develop estimates of the fair value of stock-based awards as of their measurement date. We recognize stock-based compensation expense over the requisite service period, which is the vesting period of the award. Calculating the fair value of stock-based awards requires that we make highly subjective assumptions. We use the Black-Scholes option pricing model to value our stock option awards. Use of this valuation methodology requires that we make assumptions as to the volatility of our common stock, the fair value of our common stock on the measurement date, the expected term of our stock options, the risk-free interest rate for a period that approximates the expected term of our stock options and our expected dividend yield. Because we have a limited operating history, we utilize data from a representative group of publicly traded companies to estimate the expected stock price volatility. We selected representative companies from the additive manufacturing industry with characteristics similar to us. We use the simplified method as prescribed by the SEC Staff Accounting Bulletin No. 107, Share-Based Payment as we do not have sufficient historical stock option activity data to provide a reasonable basis upon which to estimate the expected term of stock options granted to employees and non-employees. For our August 5, 2020 grants we were precluded from using the simplified method, therefore expected term for this grant was based on forecasted exercises. We utilize a dividend yield of zero based on the fact that we have never paid and are not expected to pay cash dividends. The risk-free interest rate used for each grant is an interpolated rate to match the term assumption based on the U.S. Treasury yield curve as of the valuation date.

The following table presents the dates of stock options that we granted or modified from the earliest presented period in these financial statements through December 31, 2020 with the corresponding exercise price for each option grant or modifications and our current estimate of the fair value per option on each grant or modification date, which we utilize to calculate stock-based compensation expense.


Weighted-Average 

Number of 

Estimated Fair

Estimated Fair

Share Options

Exercise Price 

Value per Share

Value per Share

Grant Date


Granted

per Share


of Common Stock

of Options

March 1, 2019

1,555,218

$

3.34

$

3.34

$

1.76

May 8, 2019

1,137,463

$

3.34

$

3.34

$

1.75

September 18, 2019

723,103

$

3.34

$

3.34

$

1.70

November 13, 2019

701,957

$

3.34

$

3.34

$

1.71

March 12, 2020

473,625

$

3.34

$

3.34

$

1.65

June 11, 2020

4,176,283

$

1.40

$

1.40

$

0.70

July 14, 2020

3,087,308

$

1.40

$

7.98

$

6.87

August 5, 2020

713,803

$

1.40

$

7.98

$

6.78

Determination of the fair value of Common Stock on Grant Dates

Prior to the Business Combination on December 9, 2020, there was no public market for our equity instruments to date, as a result, the estimated fair value of our common stock has historically been determined by our board of directors as of the grant date with input from management, considering our most recently available third-party valuations of common stock and our board of directors’ assessment of additional objective and subjective factors that the board believed were relevant and which may have changed from the date of the most recent valuation through the date of grant. We engaged an independent third-party valuation specialist to perform contemporaneous valuations of our common stock in connection with each of our convertible preferred stock issuances and as of June 30, 2019, December 31, 2019, March 31, 2020, and August 20, 2020. The valuations were performed in accordance with the guidance outlined in the American Institute of Certified Public Accountants, or AICPA, Practice Aid, Valuation of Privately-Held Company Equity Securities Issued as Compensation. The independent third-party valuation specialist considered all objective and subjective factors that it believed to be relevant for each valuation conducted in accordance with AICPA’s Practice Aid, including our best estimate of our business condition, prospects, and operating performance at each valuation date. Other significant factors included:

The rights and preferences of our preferred stock as compared to those of our common stock, including liquidation preferences of preferred stock;

55

Table of Contents

Our results of operations and financial position;

Our stage of development and business strategy and the material risks related to our business and industry;

The composition of, and changes to, our management team and board of directors;

The lack of liquidity of our common stock;

The valuation of publicly traded peer companies; and

The likelihood of achieving a liquidity event for the holders of our common stock and stock options, given prevailing market conditions

The dates of the contemporaneous valuations have not always coincided with the date of our stock option grants. In determining the exercise price of the stock options set forth in the table above, our board of directors considered, among other things, the most recent contemporaneous valuation of our common stock and their assessment of additional objective and subjective factors that were relevant as of the grant dates. These factors include the current operating performance of the Company, assumptions regarding the future operating performance of the Company, and the likelihood of achieving a liquidity event in the capital markets. If we had made different assumptions, our stock-based compensation expense, net loss, and net loss per share applicable to common stockholders could have been materially different.

Following the Business Combination, the fair value of the entity’s common stock is determined based on the quoted market price of the entity’s common stock.

Recent Accounting Pronouncements

Information regarding recent accounting pronouncements is included in “Note 2. Summary of Significant Accounting Policies” to our consolidated financial statements in this Annual Report on Form 10-K.

Item 7A. Quantitative and Qualitative Disclosures About Market Risk

We are exposed to market risks from fluctuations in interest rates, which may adversely affect our results of operations and financial condition. We seek to minimize these risks through regular operating and financing activities and, if we consider it to be appropriate, through the use of derivative financial instruments. We do not purchase, hold or sell derivative financial instruments for trading or speculative purposes. Additional information on our variable rate debt is included in “Note 13. Debt” to our consolidated financial statements in this Annual Report on Form 10-K.

Interest Rate Risk

We have exposure to interest rate risk from our variable rate debt. We do not hedge our exposure to changes in interest rates. At December 31, 2020, we had $10 million in variable rate debt outstanding. A 10% change in interest rates would have an immaterial impact on annualized interest expense.

Item 8. Financial Statements and Supplementary Data

This information is incorporated by reference from pages F-1 to F-36 of this report.

Item 9. Changes in and Disagreements with Accountants on Accounting and Financial Disclosure

None.

56

Table of Contents

Item 9A. Controls and Procedures

Background and Remediation of Material Weakness

In connection with our evaluation of disclosure controls and procedures covering our consolidated financial statements as of December 31, 2020, we identified material weaknesses in our internal control over financial reporting. We have concluded that material weaknesses exist in our evaluation of disclosure controls and procedures, including internal control over financial reporting, as we do not have the necessary business processes, personnel and related internal controls to operate in a manner to satisfy the accounting and financial reporting requirements of a public company. These material weaknesses primarily manifested in the improper segregation of duties relating to the recording of journal entries and the reconciliation of key accounts, as well as the analysis of certain transactions and accounts, and the safeguarding of assets.

We are focused on designing and implementing effective internal controls measures to improve our evaluation of disclosure controls and procedures, including internal control over financial reporting, and remediate the material weaknesses. In order to remediate these material weaknesses, we have taken and plan to take the following actions:

the hiring and continued hiring of additional accounting, finance and legal resources with public company experience; and

implementation of additional review controls and processes requiring timely account reconciliation and analyses of certain transactions and accounts.

These actions and planned actions are subject to ongoing evaluation by management and will require testing and validation of design and operating effectiveness of internal controls over financial reporting over future periods. We are committed to the continuous improvement of our internal control over financial reporting and will continue to review the internal controls over financial reporting.

Evaluation of Disclosure Controls and Procedures

Under the supervision of our Chief Executive Officer and Chief Financial Officer, our management has evaluated the effectiveness of the design and operation of our “disclosure controls and procedures” (as defined in Rules 13a-15(e) and 15(d)-15(e) under the Exchange Act) as of the end of the period covered by this Annual Report on Form 10-K. Based on this evaluation, our Chief Executive Officer and Chief Financial Officer have concluded that our disclosure controls and procedures are not effective to provide reasonable assurance that information required to be disclosed in the reports we file and submit under the Securities and Exchange Act is recorded, processed, summarized and reported as and when required.

Notwithstanding these material weaknesses noted above, our management, including our Chief Executive Officer and Chief Financial Officer, has concluded that our financial statements included in this Annual Report on Form 10-K present fairly, in all material respects, our financial position, results of operations, and cash flows for the periods presented in accordance with accounting principles generally accepted in the United States of America.

Management’s Annual Report on Internal Control Over Financial Reporting

As disclosed elsewhere in this Annual Report on Form 10-K, we completed the Business Combination on December 9, 2020. Prior to the Business Combination, Trine, our predecessor, was a special purpose acquisition company formed for the purpose of effecting a merger, capital stock exchange, asset acquisition, stock purchase, recapitalization or similar business combination with one or more businesses. As a result, previously existing internal controls are no longer applicable or comprehensive enough as of the assessment date, because Trine’s operations prior to the Business Combination were insignificant compared to those of the consolidated entity post-Business Combination. As a result, management was unable, without incurring unreasonable effort or expense, to complete an assessment of our internal control over financial reporting as of December 31, 2020. Accordingly, we are excluding management’s report on internal control over financial reporting pursuant to Section 215.02 of the SEC Division of Corporate Finance’s Regulation S-K Compliance and Disclosure Interpretations.

57

Table of Contents

Changes in Internal Control Over Financial Reporting

Except for the material weaknesses noted above, there were no changes to our internal control over financial reporting (as defined in Rule 13a-15(f) under the Exchange Act) that occurred during the quarter ended December 31, 2020 that have materially affected, or are reasonably likely to materially affect, our internal control over financial reporting.

Limitations on Effectiveness of Internal Controls

Our management, including our Chief Executive Officer and Chief Financial Officer, does not expect that our disclosure controls and procedures or internal control over financial reporting will prevent all errors and all fraud. A control system, no matter how well designed and implemented, can provide only reasonable, not absolute, assurance that the control system’s objectives will be met. Further, the design of a control system must reflect the fact that there are resource constraints and the benefits of controls must be considered relative to their costs. Due to the inherent limitations in all control systems, no evaluation of controls can provide absolute assurance that all control issues, errors and instances of fraud, if any, within the company have been or will be detected.

Item 9B. Other Information

None.

PART III

Item 10. Directors, Executive Officers, and Corporate Governance

The information required by this item will be included in our Proxy Statement for the 2021 Annual Meeting of Stockholders to be filed with the SEC within 120 days of the fiscal year ended December 31, 2020, and is incorporated herein by reference.

We have adopted a code of ethics, called the Code of Business Conduct and Ethics, which applies to our officers, including our principal executive, financial and accounting officers, and our directors and employees. We have posted the Code of Business Conduct and Ethics on our website at ir.desktopmetal.com under the “Governance Documents” section. We intend to make all required disclosures concerning any amendments to, or waivers from, the Code of Business Conduct and Ethics on our website.

Item 11. Executive Compensation

The information required by this item will be included in our Proxy Statement for the 2021 Annual Meeting of Stockholders to be filed with the SEC within 120 days of the fiscal year ended December 31, 2020, and is incorporated herein by reference.

Item 12. Security Ownership of Certain Beneficial Owners and Management and Related Stockholder Matters

The information required by this item will be included in our Proxy Statement for the 2021 Annual Meeting of Stockholders to be filed with the SEC within 120 days of the fiscal year ended December 31, 2020, and is incorporated herein by reference.

Item 13. Certain Relationships and Related Transactions, and Director Independence

The information required by this item will be included in our Proxy Statement for the 2021 Annual Meeting of Stockholders to be filed with the SEC within 120 days of the fiscal year ended December 31, 2020, and is incorporated herein by reference.

Item 14. Principal Accountant’s Fees and Services

The information required by this item will be included in our Proxy Statement for the 2021 Annual Meeting of Stockholders to be filed with the SEC within 120 days of the fiscal year ended December 31, 2020, and is incorporated herein by reference.

58

Table of Contents

Part IV

Item 15. Exhibits and Financial Statement Schedules

(a)We have filed the following documents filed as part of this Annual Report on Form 10-K:
(1)Financial Statements

Reference is made to the Index to Financial Statements beginning on page F-1, which is incorporated into this item by reference.

(2)Financial Statement Schedules

All financial statement schedules have been omitted because they are not applicable, or the required information is shown on the financial statements or notes thereto.

(3)Exhibits

The exhibits listed in the Exhibit Index are filed as part of this Annual Report on Form 10-K and are incorporated herein by reference.

(b)Exhibits

Refer to (a)(3) above.

(c)Additional Financial Statement Schedules

All financial statement schedules have been omitted because they are not applicable, or the required information is shown on the financial statements or notes thereto.

Item 16. Form 10-K Summary

None

59

Table of Contents

EXHIBIT INDEX

Incorporated by Reference

Exhibit

Form

Exhibit

Filing Date

2.1

Agreement and Plan of Merger, dated as of August 26, 2020, by and among the Company, Sparrow Merger Sub, Inc. and Legacy Desktop Metal

*

2.2

Amendment No. 1 to Agreement and Plan of Merger, dated as of September 11, 2020, by and among the Company, Sparrow Merger Sub, Inc. and Legacy Desktop Metal

*

2.3

Purchase Agreement and Plan of Merger, dated as of January 15, 2021, by and among the Company, EnvisionTEC Merger Sub, Inc., EnvisionTEC US LLC, EnvisionTEC, Inc., Gulf Filtration Systems, Inc., 3dbiotics, Inc. and Ali El Siblani

8-K

2.1

1/15/2021

3.1

Second Amended and Restated Certificate of Incorporation

8-K

3.2

12/14/2020

3.2

Amended and Restated By-laws of the Registrant

8-K

3.3

12/14/2020

4.1

Specimen Class A Common Stock Certificate

S-1

4.2

3/8/2019

4.2

Specimen Warrant Certificate

S-1

4.3

3/8/2019

4.3

Warrant Agreement, dated March 14, 2019, by and between the Company and Continental Stock Transfer & Trust Company, as warrant agent

8-K

4.1

3/20/2019

10.1

Confidentiality and Lockup Agreement, dated as of August 26, 2020, by and among the Company and the stockholder parties identified therein

S-4

10.7

9/15/2020

10.2

Amended and Restated Registration Rights Agreement, dated as of August 26, 2020, by and among the Company, certain equity holders of the Company named therein and certain equity holders of Legacy Desktop Metal named therein

S-1

10.8

1/19/2021

10.3

Sponsor Agreement, dated as of August 26, 2020, by and among the Company, its officers and directors, Legacy Desktop Metal and the Sponsor

S-4

10.9

9/15/2020

10.4

Stockholders Agreement, dated as of August 26, 2020, by and between the Company and Trine Sponsor IH, LLC

S-4

10.10

9/15/2020

10.5

Form of Subscription Agreement

S-4

10.12

9/15/2020

10.6

Form of Director and Officer Indemnification Agreement

S-4

10.13

9/15/2020

10.7

Non-Employee Director Compensation Program

S-1

10.13

12/23/2020

10.8

2015 Stock Incentive Plan

S-4

10.14

10/15/2020

10.9

Form of Incentive Stock Option Agreement under the 2015 Stock Incentive Plan

S-4

10.15

10/15/2020

10.10

Form of RSU Agreement under the 2015 Stock Incentive Plan

S-4

10.17

10/15/2020

10.11

2020 Incentive Award Plan

*

10.12

Form of Stock Option Agreement under the 2020 Incentive Award Plan

S-4

10.20

9/15/2020

10.13

Form of RSU Agreement under the 2020 Incentive Award Plan

S-4

10.21

9/15/2020

10.14

Form of Restricted Stock Agreement under the 2020 Incentive Award Plan

S-4

10.22

9/15/2020

10.15

Restricted Stock Agreement, dated as of September 18, 2015 by and between Desktop Metal and Ric Fulop

S-4

10.18

10/15/2020

10.16

Offer Letter, dated as of January 31, 2019, by and between Legacy Desktop Metal and Steve Billow

S-4

10.26

11/2/2020

10.17

Offer Letter, dated as of September 28, 2020, by and between Legacy Desktop Metal and Elizabeth Linardos

S-4

10.29

11/2/2020

60

Table of Contents

10.18

Amendment to Stock Option Agreement, dated as of September 28, 2020, by and between Elizabeth Linardos and Legacy Desktop Metal

S-4

10.31

11/2/2020

10.19

Separation Agreement, dated as of February 8, 2021, by and between Desktop Metal and Elizabeth Linardos

*

10.20

Offer Letter, dated as of February 8, 2021, by and between Desktop Metal and James Haley

*

10.21

Offer Letter, dated as of February 16, 2021, by and between Desktop Metal and Ali El Siblani

*

10.22

Northwest Park Office Lease, dated as of August 23, 2016, by and between NWP Building 24 LLC and Legacy Desktop Metal

S-4

10.27

10/15/2020

10.23

Amendment to Northwest Park Office Lease, dated as of October 3, 2017, by and between NWP Building 24 LLC and Legacy Desktop Metal

S-4

10.28

10/15/2020

21.1

Subsidiaries of the Company

31.1

Certification of Chief Executive Officer pursuant to Rule 13a-14(a)

*

31.2

Certification of Chief Financial Officer pursuant to Rule 13a-14(a)

*

32.1

Certification of Chief Executive Officer and Chief Financial Officer of Periodic Report Pursuant to 18 U.S.C. Section 1350

*

101.INS

XBRL Instance Document

*

101.SCH

XBRL Taxonomy Extension Schema Document

*

101.CAL

XBRL Taxonomy Calculation Linkbase Document

*

101.DEF

XBRL Taxonomy Definition Linkbase Document

*

101.LAB

XBRL Taxonomy Extension Label Linkbase Document

*

101.PRE

XBRL Taxonomy Extension Presentation Linkbase Document

*

104

Cover Page Interactive Data File (formatted as inline XBRL and contained in Exhibit 101)

*

*

Filed with this Annual Report on Form 10-K.

61

Table of Contents

SIGNATURES

Pursuant to the requirements of Section 13 or 15(d) of the Securities Exchange Act of 1934, the registrant has duly caused this report to be signed on its behalf by the undersigned, thereunto duly authorized, on March 15, 2021.

DESKTOP METAL, INC.

By:

/s/ Ric Fulop

Ric Fulop

Chief Executive Officer

(Principal Executive Officer)

Pursuant to the requirements of the Securities Exchange Act of 1934, this report has been signed below by the following persons on behalf of the registrant and in the capacities indicated:

Signature

Title

Date

/s/ Ric Fulop

Chief Executive Officer

March 15, 2021

Ric Fulop

(Principal Executive Officer)

/s/ James Haley

Chief Financial Officer

March 15, 2021

James Haley

(Principal Financial Officer and Principal Accounting Officer)

/s/ Scott Dussault

Director

March 15, 2021

Scott Dussault

/s/ Ali El-Siblani

Director

March 15, 2021

Ali El-Siblani

/s/ Dayna Grayson

Director

March 15, 2021

Dayna Grayson

/s/ Leo Hindery, Jr.

Director

March 15, 2021

Leo Hindery, Jr.

/s/ Wen Hsieh

Director

March 15, 2021

Wen Hsieh

/s/ Jeff Immelt

Director

March 15, 2021

Jeff Immelt

/s/ Byron Knight

Director

March 15, 2021

Byron Knight

/s/ Stephen Nigro

Director

March 15, 2021

Stephen Nigro

/s/ Steve Papa

Director

March 15, 2021

Steve Papa

/s/ Andy Wheeler

Director

March 15, 2021

Andy Wheeler

/s/ Bilal Zuberi

Director

March 15, 2021

Bilal Zuberi

62

Table of Contents

INDEX TO CONSOLIDATED FINANCIAL STATEMENTS

Report of Independent Registered Public Accounting Firm

F-2

Consolidated Balance Sheets as of December 31, 2020 and 2019

F-3

Consolidated Statements of Operations for the years ended December 31, 2020 and 2019

F-4

Consolidated Statements of Comprehensive Loss for the years ended December 31, 2020 and 2019

F-5

Consolidated Statements of Stockholders’ Equity for the years ended December 31, 2020 and 2019

F-6

Consolidated Statements of Cash Flows for the years ended December 31, 2020 and 2019

F-7

Notes to Consolidated Financial Statements

F-8

F-1

Table of Contents

REPORT OF INDEPENDENT REGISTERED PUBLIC ACCOUNTING FIRM

To the stockholders and the Board of Directors of Desktop Metal, Inc.

Opinion on the Financial Statements

We have audited the accompanying consolidated balance sheets of Desktop Metal, Inc. and subsidiaries (the "Company") as of December 31, 2020 and 2019, the related consolidated statements of operations, comprehensive loss, stockholders' equity, and cash flows, for each of the two years in the period ended December 31, 2020, and the related notes (collectively referred to as the "financial statements"). In our opinion, the financial statements present fairly, in all material respects, the financial position of the Company as of December 31, 2020 and 2019, and the results of its operations and its cash flows for each of the two years in the period ended December 31, 2020, in conformity with accounting principles generally accepted in the United States of America.

Basis for Opinion

These financial statements are the responsibility of the Company's management. Our responsibility is to express an opinion on the Company's financial statements based on our audits. We are a public accounting firm registered with the Public Company Accounting Oversight Board (United States) (PCAOB) and are required to be independent with respect to the Company in accordance with the U.S. federal securities laws and the applicable rules and regulations of the Securities and Exchange Commission and the PCAOB.

We conducted our audits in accordance with the standards of the PCAOB. Those standards require that we plan and perform the audit to obtain reasonable assurance about whether the financial statements are free of material misstatement, whether due to error or fraud. The Company is not required to have, nor were we engaged to perform, an audit of its internal control over financial reporting. As part of our audits, we are required to obtain an understanding of internal control over financial reporting but not for the purpose of expressing an opinion on the effectiveness of the Companys internal control over financial reporting. Accordingly, we express no such opinion.

Our audits included performing procedures to assess the risks of material misstatement of the financial statements, whether due to error or fraud, and performing procedures that respond to those risks. Such procedures included examining, on a test basis, evidence regarding the amounts and disclosures in the financial statements. Our audits also included evaluating the accounting principles used and significant estimates made by management, as well as evaluating the overall presentation of the financial statements. We believe that our audits provide a reasonable basis for our opinion.

/s/ Deloitte & Touche LLP

Boston, Massachusetts

March 15, 2021

We have served as the Company's auditor since 2016.

F-2

Table of Contents

DESKTOP METAL, INC.

CONSOLIDATED BALANCE SHEETS

(in thousands, except share and per share amounts)

December 31, 


2020


2019

Assets

Current assets:


Cash and cash equivalents

$

483,525

$

66,161

Short‑term investments


111,867


84,754

Accounts receivable


6,516


4,523

Inventory


9,708


8,405

Prepaid expenses and other current assets


976


1,888

Total current assets


612,592


165,731

Restricted cash


612


612

Property and equipment, net


12,160


18,387

Capitalized software, net


312


446

Goodwill


2,252


2,252

Acquired technology, net


9,102


2,994

Other noncurrent assets

4,879

2,289

Total Assets

$

641,909

$

192,711

Liabilities and Stockholders’ Equity


Current liabilities:


Accounts payable

$

7,591

$

10,228

Customer deposits


1,480


2,325

Current portion of operating lease liability


868


806

Accrued expenses and other current liabilities


7,565


5,053

Deferred revenue


3,004


2,230

Current portion of long‑term debt, net of deferred financing costs


9,991


Total current liabilities


30,499


20,642

Long‑term debt, net of deferred financing costs


9,972

Lease liability, net of current portion


2,157


3,026

Total liabilities

32,656

33,640

Commitments and Contingences (Note 15)


Legacy Convertible Preferred Stock (Note 17)

Stockholders’ Equity


Preferred Stock, $0.0001 par value—authorized, 50,000,000 shares; no shares issued and outstanding at December 31, 2020 and December 31, 2019, respectively

Common Stock, $0.0001 par value—500,000,000 shares authorized; 226,756,733 and 160,500,702 shares issued at December 31, 2020 and December 31, 2019, respectively, 224,626,597 and 154,913,934 shares outstanding at December 31, 2020 and December 31, 2019, respectively


23


16

Additional paid‑in capital


993,933


453,242

Accumulated deficit


(384,694)


(294,262)

Accumulated other comprehensive (loss) income


(9)


75

Total Stockholders’ Equity


609,253


159,071

Total Liabilities and Stockholders’ Equity

$

641,909

$

192,711

See notes to consolidated financial statements.

F-3

Table of Contents

DESKTOP METAL, INC.

CONSOLIDATED STATEMENTS OF OPERATIONS

(in thousands, except per share amounts)

Years Ended December 31, 


2020


2019

Revenues


Products

$

13,718

$

22,758

Services


2,752


3,681

Total revenues


16,470


26,439

Cost of sales


Products


26,945


45,268

Services


4,574


5,528

Total cost of sales


31,519


50,796

Gross margin


(15,049)


(24,357)

Operating expenses


Research and development


43,136


54,656

Sales and marketing


13,136


18,749

General and administrative


20,734


11,283

Total operating expenses


77,006


84,688

Loss from operations


(92,055)


(109,045)

Interest expense


(328)


(503)

Interest and other income, net


1,011


5,952

Loss before income taxes


(91,372)


(103,596)

Income tax benefit


940


Net loss

$

(90,432)

$

(103,596)

Net loss per share—basic and diluted

$

(0.57)

$

(0.69)

See notes to consolidated financial statements.

F-4

Table of Contents

DESKTOP METAL, INC.

CONSOLIDATED STATEMENTS OF COMPREHENSIVE LOSS

(in thousands)

Years Ended December 31, 


2020


2019

Net loss

$

(90,432)

$

(103,596)

Other comprehensive (loss) income, net of taxes:


Unrealized (loss) gain on available-for-sale marketable securities, net


(84)


171

Total comprehensive loss, net of taxes of $0

$

(90,516)

$

(103,425)

See notes to consolidated financial statements.

F-5

Table of Contents

DESKTOP METAL, INC.

CONSOLIDATED STATEMENTS OF STOCKHOLDERS’ EQUITY

(in thousands, except share amounts)

Accumulated

Other

Convertible

Additional

Comprehensive

Total

Preferred Stock

Common Stock

Paidin

Notes

Accumulated

(Loss)

Stockholders’


Shares


Amount


Shares


Amount


Capital


Receivable


Deficit


Income


Equity

BALANCE—January 1, 2019

84,092,669

$

276,889

19,352,255

$

2

$

6,440

$

(249)

$

(190,666)

$

(96)

$

(184,569)

Retroactive application of recapitalization (Note 1)

(84,092,669)

(276,889)

106,977,440

11

276,878

276,889

Adjusted balance, beginning of period

126,329,695

13

283,318

(249)

(190,666)

(96)

92,320

Issuance of Series E Convertible Preferred Stock—net of issuance costs ($124) (1)


16,426,267


2


134,665


134,667

Issuance of Series E-1 Convertible Preferred Stock—net of issuance costs ($22) (1)


3,046,623


24,977


24,977

Exercise of Common Stock options


1,217,255


708


708

Vesting of restricted Common Stock


6,904,182


1


7


8

Stock‑based compensation expense


5,215


5,215

Common Stock warrants issued


1,038


1,038

Issuance of Common Stock for acquisitions

1,066,373

3,563

3,563

Repayment of notes receivable


(76,461)


(249)


249


Net loss

(103,596)

(103,596)

Other comprehensive income

171

171

BALANCE—December 31, 2019

154,913,934

16

453,242

(294,262)

75

159,071

Exercise of Common Stock options


521,925


325


325

Vesting of restricted Common Stock


5,307,357


1


6


7

Issuance of Common Stock in connection with acquisitions

61,060

500


500

Repurchase of shares for employee tax withholdings

(9,308)

(101)

(101)

Stock‑based compensation expense


8,006


8,006

Common Stock warrants issued and exercised


692,366


1,915


1,915

Reverse recapitalization, net of transaction costs


63,139,263


6


530,040


530,046

Net loss


(90,432)


(90,432)

Other comprehensive loss


(84)


(84)

BALANCE—December 31, 2020


$


224,626,597

$

23

$

993,933

$

$

(384,694)

$

(9)

$

609,253

(1) Issuance of Series E Convertible Preferred stock has been retroactively restated to give effect to the recapitalization transaction.

See notes to consolidated financial statements.

F-6

Table of Contents

DESKTOP METAL, INC.

CONSOLIDATED STATEMENTS OF CASH FLOWS

(in thousands)

Years Ended December 31, 


2020


2019

Cash flows from operating activities:

Net loss

$

(90,432)


$

(103,596)

Adjustments to reconcile net loss to net cash used in operating activities:


Depreciation and amortization


8,589


8,087

Stock‑based compensation


8,006


5,215

Expense related to Common Stock warrants issued


1,915


1,038

Loss (gain) on disposal of property and equipment


18


(7)

Gain on investment, related to Make Composites, Inc.


(1,426)

Impairment of capitalized software

444

Amortization (accretion) of discount on investments

75

(1,570)

Amortization of debt financing cost

19

19

Provision for bad debt

377

199

Net increase in accrued interest related to marketable securities

(3)

(36)

Deferred tax benefit

(940)

Changes in operating assets and liabilities:


Accounts receivable


(2,370)


(1,664)

Inventory


(1,303)


(1,694)

Prepaid expenses and other current assets


901


809

Accounts payable


(2,637)


(4,455)

Accrued expenses and other current liabilities


(2,391)


3,272

Customer deposits


(845)


152

Deferred revenue


774


(1,693)

Change in right of use assets and lease liabilities, net


(328)


(296)

Net cash used in operating activities


(80,575)


(97,202)

Cash flows from investing activities:


Purchases of property and equipment


(1,429)


(6,867)

Purchase of other investments

(3,000)

Capitalized software

(321)

Purchase of marketable securities


(136,286)


(215,584)

Proceeds from sales and maturities of marketable securities


109,016


196,836

Cash paid for asset acquisition, net of cash acquired


(5,284)


(96)

Net cash used in investing activities


(36,983)


(26,032)

Cash flows from financing activities:


Proceeds from Preferred Stock issuances, net of issuance cost


159,644

Proceeds from reverse recapitalization, net of issuance costs

534,597

Proceeds from exercise of stock options


325


708

Proceeds from PPP loan

5,379

Repayment of PPP loan


(5,379)


Net cash provided by financing activities


534,922


160,352

Net increase in cash, cash equivalents, and restricted cash


417,364


37,118

Cash and cash equivalents at beginning of year


66,161


29,043

Restricted cash


612


612

Cash, cash equivalents, and restricted cash at year-end

$

484,137

$

66,773

Supplemental cash flow information:


Interest paid

$

322

$

485

Noncash investing and financing activities:


Net liabilities assumed from Trine in Business Combination

$

2,650

Accrued reverse recapitalization transaction costs

$

1,901

Common Stock issued for acquisitions

$

500

$

3,563

Accrued purchase price for asset acquisition

$

200

Tax liabilities related to withholdings on Common Stock issued in connection with acquisitions

$

102

Additions to right of use assets and lease liabilities

$

$

296

Purchase of property and equipment included in accrued expenses and other current liabilities

$

$

109

Common Stock forfeited in satisfaction of note receivable

$

$

249

See notes to consolidated financial statements.

F-7

Table of Contents

DESKTOP METAL, INC.

NOTES TO CONSOLIDATED FINANCIAL STATEMENTS

1. ORGANIZATION, NATURE OF BUSINESS, AND RISK AND UNCERTAINTIES

Organization and Nature of Business

Desktop Metal, Inc. is a Delaware corporation headquartered in Burlington, Massachusetts. The company was founded in 2015 and is accelerating the transformation of manufacturing with 3D printing solutions for engineers, designers, and manufacturers. The Company designs, produces and markets 3D printing systems to a variety of end customers.

On December 9, 2020 (the “Closing Date”), Trine Acquisition Corp. (“Trine”) consummated the previously announced merger pursuant to the Agreement and Plan of Merger, dated August 26, 2020, by and among Trine, Desktop Metal, Inc. and Sparrow Merger Sub, Inc., pursuant to which Sparrow Merger Sub, Inc. merged with and into Desktop Metal, Inc., with Desktop Metal, Inc. becoming our wholly owned subsidiary (the “Business Combination”). Upon the closing of the Business Combination, Trine changed its name to Desktop Metal, Inc. and Desktop Metal, Inc. changed its name to Desktop Metal Operating, Inc.

Unless otherwise indicated or the context otherwise requires, references in this Annual Report on Form 10-K to the “Company” and “Desktop Metal” refer to the consolidated operations of Desktop Metal, Inc. and its subsidiaries. References to “Trine” refer to the company prior to the consummation of the Business Combination and references to “Legacy Desktop Metal” refer to Desktop Metal Operating, Inc. prior to the consummation of the Business Combination.

Legacy Desktop Metal was deemed the accounting acquirer in the Business Combination based on an analysis of the criteria outlined in Accounting Standards Codification (“ASC”) 805. This determination was primarily based on Legacy Desktop Metal’s stockholders prior to the Business Combination having a majority of the voting power in the combined company, Legacy Desktop Metal having the ability to appoint a majority of the Board of Directors of the combined company, Legacy Desktop Metal’s existing management comprising the senior management of the combined company, Legacy Desktop Metal comprising the ongoing operations of the combined company, Legacy Desktop Metal being the larger entity based on historical revenues and business operations, and the combined company assuming Legacy Desktop Metal’s name. Accordingly, for accounting purposes, the Business Combination was treated as the equivalent of Legacy Desktop Metal issuing stock for the net assets of Trine, accompanied by a recapitalization. The net assets of Trine are stated at historical cost, with no goodwill or other intangible assets recorded.

While Trine was the legal acquirer in the Business Combination, because Legacy Desktop Metal was deemed the accounting acquirer, the historical financial statements of Legacy Desktop Metal became the historical financial statements of the combined company upon the consummation of the Business Combination. As a result, the financial statements included in this report reflect (i) the historical operating results of Legacy Desktop Metal prior to the Business Combination; (ii) the combined results of Trine and Legacy Desktop Metal following the close of the Business Combination; (iii) the assets and liabilities of Legacy Desktop Metal at their historical cost; and (iv) the Company’s equity structure for all periods presented.

In accordance with guidance applicable to these circumstances, the equity structure has been restated in all comparative periods up to the Closing Date to reflect the number of shares of the Company’s common stock, $0.0001 par value per share, issued to Legacy Desktop Metal’s stockholders in connection with the Business Combination. As such, the shares and corresponding capital amounts and earnings per share related to Legacy Desktop Metal convertible preferred stock and Legacy Desktop Metal common stock prior to the Business Combination have been retroactively restated as shares reflecting the exchange ratio of 1.22122 established in the Business Combination. Legacy Desktop Metal’s convertible preferred stock previously classified as mezzanine was retroactively adjusted, converted into Common Stock, and reclassified to permanent as a result of the reverse recapitalization.

Risks and Uncertainties

The Company is subject to a number of risks similar to those of other companies of similar size in its industry, including, but not limited to, the need for successful development of products, the need for additional funding, competition from substitute products and services from larger companies, protection of proprietary technology, patent litigation, dependence on key individuals, and risks associated with changes in information technology. The Company has financed its operations to date primarily with proceeds from the sale of preferred stock and the Business Combination. The Company’s long-term success is dependent upon its ability to successfully

F-8

Table of Contents

DESKTOP METAL, INC.

NOTES TO CONSOLIDATED FINANCIAL STATEMENTS

market its products and services; generate revenue; maintain or reduce its operating costs and expenses; meet its obligations; obtain additional capital when needed; and, ultimately, achieve profitable operations. Management believes that existing cash and investments as of December 31, 2020 will be sufficient to fund operating and capital expenditure requirements through at least twelve months from the date of issuance of these consolidated financial statements.

2. SUMMARY OF SIGNIFICANT ACCOUNTING POLICIES

Basis of Presentation

The consolidated financial statements of the Company are prepared in conformity with accounting principles generally accepted in the United States of America (“US GAAP”) and pursuant to the regulations of the U.S Securities and Exchange Commission (“SEC”).

Principles of Consolidation

The accompanying consolidated financial statements include the accounts of the Company and its wholly owned subsidiaries. The functional currency of all wholly owned subsidiaries is U.S. Dollars. All intercompany transactions and balances have been eliminated in consolidation.

COVID-19 Pandemic

In March 2020, the World Health Organization declared the outbreak of a disease caused by a novel strain of the coronavirus (“COVID-19”) to be a pandemic. As of December 31, 2020, the impact of the COVID-19 pandemic continues to unfold and there has been uncertainty and disruption in the global economy and financial markets. The Company has considered the COVID-19 pandemic related impacts on its estimates, as appropriate, within its consolidated financial statements and there may be changes to those estimates in future periods.

The COVID-19 pandemic, as well as the response to mitigate the spread and effects of COVID-19, may impact the Company and its customers, as well as the demand for its products and services. The impact of COVID-19 on the Company’s operational results in subsequent periods will largely depend on future developments, and cannot be accurately predicted. These developments may include, but are not limited to, new information concerning the severity of COVID-19, the degree of success of actions take to contain or treat COVID-19 and the reactions by consumers, companies, governmental entities, and capital markets to such actions.

Use of Estimates

The preparation of the consolidated financial statements in conformity with GAAP requires the Company’s management to make judgements, estimates and assumptions regarding uncertainties that affect the reported amounts of assets, liabilities and related disclosures of contingent assets and liabilities at the date of the consolidated financial statements, and the reported amounts of revenues and expenses during the reporting period. Significant estimates and assumptions reflected in these consolidated financial statements include, but are not limited to, revenue recognition, collectability of receivables, realizability of inventory, goodwill, intangibles, stock-based compensation, and fair values of common stock. The Company bases its estimates on historical experience and various other factors believed to be reasonable under the circumstances, the results of which form the basis for making judgments about the carrying value of assets and liabilities. The Company assesses estimates on an ongoing basis; however, actual results could materially differ from those estimates.

Cash and Cash Equivalents

Cash and cash equivalents consist of standard checking accounts, money market accounts and certain investments. The Company classifies any marketable security with an original maturity date of 90 days or less at the time of purchase as a cash equivalent. 

F-9

Table of Contents

DESKTOP METAL, INC.

NOTES TO CONSOLIDATED FINANCIAL STATEMENTS

Short-Term Investments

The Company invests its excess cash in fixed income instruments denominated and payable in U.S. dollars including U.S. treasury securities, commercial paper, corporate bonds and asset-backed securities in accordance with the Company’s investment policy that primarily seeks to maintain adequate liquidity and preserve capital. Short-term investments represent holdings of available-for-sale marketable securities in accordance with the Company’s investment policy and cash management strategy. Investments in marketable securities are recorded at fair value, with any unrealized gains and losses reported within accumulated other comprehensive income as a separate component of stockholders’ equity until realized or until a determination is made that an other-than-temporary decline in market value has occurred. When such reductions occur, the cost of the investment is adjusted to fair value through recording a loss on investments in the consolidated statements of operations. All investments mature within one year.

Restricted Cash

The Company maintains a letter of credit for the benefit of the landlord for their office facility. The issuer of the letter of credit requires the Company to maintain a deposit in the amount of $0.6 million to secure the letter, which is reported as restricted cash in the consolidated balance sheets. This letter of credit automatically renews every year until it matures on February 7, 2024; therefore, it is classified as long term in nature at December 31, 2020 and 2019.

Financial Instruments

The Company’s financial instruments are comprised of cash and cash equivalents, short-term investments, restricted cash, accounts receivable and accounts payable. The Company’s other current financial assets and current financial liabilities have fair values that approximate their carrying values due to the short maturity of these balances.  

Revenue

Product Revenue and Service Revenue

Product revenue include sales of the Company’s additive manufacturing systems as well as sale of related accessories and consumables. These consumables are primarily comprised of materials, which are used by the printers during the printing process to produce parts. Certain on-device software is embedded with the hardware and sold with the product bundle and is included within product revenue. Revenue from products is recognized upon transfer of control, which is generally at the point of shipment.

Services revenue consists of installation, training, and post-installation hardware and software support, as well as various software solutions the Company offers to facilitate the design of parts and operation of the Company’s products. The Company offers multiple software products, which are licensed through either a cloud-based solution and/or an on-device software subscription, depending on the product. For the cloud-based solution, the Company typically provides an annual subscription that the customer does not have the right to take possession of and is renewable at expiration. The revenue from the cloud-based solution is recognized ratably over the annual term as the Company considers the services provided under the cloud-based solution to be a series of distinct performance obligations, as the Company provides continuous daily access to the cloud solution. For on-device software subscriptions, the Company typically recognizes revenue once the customer has been given access to the software. When the Company enters into development contracts, control of the development service is transferred over time, and the related revenue is recognized as services are performed.

Revenue Recognition

Revenue is measured as the amount of consideration expected to be received in exchange for transferring goods or providing services. The amount of consideration is typically a fixed price at the contract inception. Consideration from shipping and handling is recorded on a gross basis within product revenue.

F-10

Table of Contents

DESKTOP METAL, INC.

NOTES TO CONSOLIDATED FINANCIAL STATEMENTS

The Company determines revenue recognition through the following steps:

Identification of the contract, or contracts, with a customer

Identification of the performance obligations in the contract

Determination of the transaction price

Allocation of the transaction price to the performance obligations in the contract

Recognition of revenue when, or as, the Company satisfies a performance obligation

Nature of Products and Services

The Company sells its products primarily through authorized resellers, independent sales agents, and its own sales force. Revenue from hardware and consumables is recognized upon transfer of control, which is generally at the point of shipment.

The Company’s post-installation support is primarily sold through one-year annual contracts and such revenue is recognized ratably over the term of the agreement. Service revenue from installation and training is recognized as performed.

The Company’s terms of sale generally provide payment terms that are customary in the countries where the Company transacts business. To reduce credit risk in connection with certain sales, the Company may, depending upon the circumstances, require significant deposits or payment in full prior to shipment.

Due to the short-term nature of the Company’s contracts substantially all of the outstanding performance obligations are recognized within one year.

Shipping and handling activities that occur after control over a product has transferred to a customer are accounted for as fulfillment activities rather than performance obligations, as allowed under a practical expedient provided by ASC 606. The shipping and handling fees charged to customers are recognized as revenue and the related costs are included in cost of revenue at the point in time when ownership of the product is transferred to the customer. Sales taxes and value added taxes collected concurrently with revenue generating activities are excluded from revenue.

Significant Judgements

The Company enters into contracts with customers that can include various combinations of hardware products, software licenses, and services, which are distinct and accounted for as separate performance obligations. Products or services that are promised to a customer can be considered distinct if both of the following criteria are met: (i) the customer can benefit from the products or services either on its own or together with other readily available resources and (ii) the Company’s promise to transfer the products, software, or services to the customer is separately identifiable from other promises in the contract. Determining whether products and services are considered distinct performance obligations that should be accounted for separately versus together may require significant judgment.

Judgement is required to determine the standalone selling price (“SSP”). The transaction price is allocated to each distinct performance obligation on a relative standalone selling price basis and revenue is recognized for each performance obligation when control has passed. In most cases, the Company is able to establish SSP based historical transaction data of the observable prices of hardware products sold separately in comparable circumstances to similar customers, observable renewal rates for software and post-installation support, and the Company’s best estimate of the selling price at which the Company would have sold the product regularly on a stand-alone basis for training and installation. The Company reassesses the SSP on a periodic basis or when facts and circumstances change.

F-11

Table of Contents

DESKTOP METAL, INC.

NOTES TO CONSOLIDATED FINANCIAL STATEMENTS

Contract Balances

The timing of revenue recognition, billings and cash collections results in billed accounts receivable, customer deposits and deferred revenues (contract liabilities) on the consolidated balance sheets. Timing of revenue recognition may differ from the timing of invoicing to customers. The Company records a receivable at the time of invoicing. For most contracts, customers are invoiced when products are shipped or when services are performed. The Company will typically bill in advance for post-installation support and cloud-based software licenses, resulting in deferred revenue.

The Company’s deferred revenue balance was $3.0 million and $2.2 million as of December 31, 2020 and 2019, respectively. During the year ended December 31, 2020, the Company recognized $2.2 million of deferred revenue from 2019. The deferred revenue consists primarily of billed post-installation support and cloud-based software licenses that are recognized ratably over the term of the agreement, as well as contracts that have outstanding performance obligations or contracts that have acceptance terms that have not yet been fulfilled.

When products have been delivered, but the product revenue associated with the arrangement has been deferred the Company includes the costs for the delivered items in deferred costs of sales on the consolidated balance sheets until recognition of the related revenue occurs, at which time it is recognized in cost of sales. The Company’s deferred cost of sales balance was $0.5 and $0.3 million as of December 31, 2020 and 2019, respectively.

The Company’s contracts are primarily one year or less, so substantially all deferred revenue outstanding at the end of the fiscal year is recognized during the following year.

The Company primarily sells products through a reseller network. Under this arrangement, the reseller is determined to be the Company’s customer, and revenue is recognized based on the amounts the Company is entitled to, reduced by any payments owed to the resellers. On certain contracts, the Company utilizes external partners and an internal sales team to sell direct to the end user. The Company acts as a principal in the contracts with users when utilizing external partners because the Company controls the product, establishing the price, and bearing the risk of nonperformance, until it is transferred to the end user. The Company records the revenue on a gross basis and commissions are recorded as a sales and marketing expense in the statement of operations. The Company recognizes its commission expense as a point-in-time expense as contract obligations are primarily completed within a one-year contract period. During the years ended December 31, 2020 and 2019, the Company paid $0.6 million and $0.4 million of commission expense, respectively.

Allowance for Doubtful Accounts

In evaluating the collectability of accounts receivable, the Company assesses a number of factors, including specific customers’ abilities to meet their financial obligations, the length of time receivables are past due, and historical collection experience. If circumstances related to specific customers change, or economic conditions deteriorate such that past collection experience is no longer relevant, the Company’s estimate of the recoverability of accounts receivable could be further reduced from the levels provided for in the consolidated financial statements.

The Company evaluates specific accounts for which it is believed a customer may have an inability to meet their financial obligations. In these cases, judgment is applied, based on available facts and circumstances, and a specific reserve is recorded for that customer to reduce the receivable to an amount expected to be collected. These specific reserves are reevaluated and adjusted as additional information is received that impacts the amount reserved.

As of December 31, 2020, and 2019, the Company has recorded $0.5 million and $0.2 million respectively, in allowance of doubtful accounts. In the years ended December 31, 2020 and 2019 the Company recorded bad debt expense of $0.4 million and $0.2 million, respectively.

F-12

Table of Contents

DESKTOP METAL, INC.

NOTES TO CONSOLIDATED FINANCIAL STATEMENTS

Net Loss Per share

The Company presents basic and diluted loss per share amounts. Basic loss per share is calculated by dividing net loss available to holders of Common Stock by the weighted average number of shares of Common Stock outstanding during the applicable period.

The denominator for diluted earnings per share is a computation of the weighted-average number of ordinary shares and the potential dilutive ordinary shares outstanding during the period. Potential dilutive shares outstanding include the dilutive effect of in-the-money options and unvested Restricted Stock Agreements (“RSAs”), and unvested Restricted Stock Units (“RSUs”) using the treasury stock method. In periods in which the Company reports a net loss, diluted net loss per share is the same as basic net loss per share because dilutive shares are not assumed to have been issued if their effect is anti-dilutive.

See Note 20 for further information.

Warranty Reserve

Substantially all of the Company’s hardware and software products are covered by a standard assurance warranty of one year, and estimated warranty obligations are recorded as an expense at the time or revenue recognition. In the event of a failure of hardware product or software covered by this warranty, the Company will repair or replace the software or hardware product. The Company’s warranty reserve reflects estimated material and labor costs for potential or actual product issues in its installed base for which the Company expects to incur an obligation. The Company periodically assesses the adequacy of the warranty reserve and adjusts the amount as necessary. If the data used to calculate the adequacy of the warranty reserve are not indicative of future requirements, additional or reduced warranty reserves may be required.

As of December 31, 2020, and 2019 the Company has recorded $1.6 million and $1.5 million, respectively, of warranty reserve within accrued expenses and other current liabilities on the consolidated balance sheets. Warranty reserve consisted of the following (in thousands):


2020


2019

Warranty reserve, at the beginning of the year

$

1,491

$

116

Additions to warranty reserve


346


2,352

Claims fulfilled


(284)


(977)

Warranty reserve, at the end of the year

$

1,553

$

1,491

Warranty reserve is recorded through cost of sales in the consolidated statements of operations.

Inventory

Inventory is stated at the lower of cost or net realizable value, determined on a first-in, first-out basis, and consists of the following (in thousands):

December 31, 


2020


2019

Work in process

$

2,896

$

1,081

Finished goods


6,812


7,324

Total inventory

$

9,708

$

8,405

The Company provides for inventory losses based on obsolescence and levels in excess of forecasted demand. Inventory is reduced to the estimated net realizable value based on historical usage and expected demand.

Inventory provisions based on obsolescence and inventory in excess of forecasted demand are recorded through cost of sales in the consolidated statements of operations.

F-13

Table of Contents

DESKTOP METAL, INC.

NOTES TO CONSOLIDATED FINANCIAL STATEMENTS

Concentrations of Credit Risk and Off-Balance-Sheet Risk

The Company has no significant off-balance-sheet risk, such as foreign exchange contracts, option contracts, or other foreign hedging arrangements. Financial instruments that potentially expose the Company to concentrations of credit risk consist mainly of cash and cash equivalents. The Company maintains its cash and cash equivalents principally with accredited financial institutions of high-credit standing.

As of December 31, 2020, and 2019, no single customer accounted for more than 10% of revenue. As of December 31, 2020 and 2019, no single customer accounted for more than 10% of total accounts receivables.

Customer Deposits

Payments received from customers who have placed reservations or purchase orders in advance of shipment are refundable upon cancellation or non-delivery by the Company and are included within customer deposits on the consolidated balance sheets.

Other Investments

The Company periodically makes investments in companies within the additive manufacturing industry. The Company monitors events or changes in circumstances that may have a significant effect on the fair value of investments, either due to impairment or based on observable price changes, and records necessary adjustments.

Property and Equipment

Property and equipment is stated at cost. Expenditures for repairs and maintenance are expensed as incurred. When assets are retired or disposed of, the assets and related accumulated depreciation are eliminated from the accounts and any resulting gain or loss is included in the determination of net income or loss.

Depreciation is expensed using the straight-line method over the estimated useful lives of the assets as follows:

Asset Classification


Useful Life

Equipment


35 years

Furniture and fixtures


3 years

Computer equipment


3 years

Tooling


3 years

Software


3 years

Leasehold improvements


Shorter of asset’s useful life or remaining life of the lease

Leases

The Company determines if an arrangement is a lease at inception. The Company typically only includes an initial lease term in its assessment of a lease arrangement. Options to renew a lease are not included in the Company’s assessment unless there is reasonable certainty that the Company will renew. The Company assesses it plans to renew its material leases on an annual basis. Operating leases are included in other assets, current portion of lease liability, and lease liability, net of current portion on the Company’s consolidated balance sheets.

Right of use (“ROU”) assets and lease liabilities are recognized based on the present value of the future minimum lease payments over the expected remaining lease term. As the interest rate implicit in the Company’s leases is typically not readily determinable, the Company uses its incremental borrowing rate for a similar term of lease payments based on the information available at commencement date in determining the present value of future payments.

F-14

Table of Contents

DESKTOP METAL, INC.

NOTES TO CONSOLIDATED FINANCIAL STATEMENTS

The Company elected the short-term lease recognition and therefore, the Company does not recognize right of use assets or lease liabilities for leases with less than a twelve-month duration. The Company also elected the practical expedient to account for lease agreements which contain both lease and non-lease components as a single lease component.

Business Combinations

The Company allocates the purchase price of acquired companies to the tangible and intangible assets acquired and liabilities assumed based on their estimated fair values. The Company generally values the identifiable intangible assets acquired using a discounted cash flow model. The significant estimates used in valuing certain of the intangible assets, include, but are not limited to future expected cash flows of the asset, discount rates to determine the present value of the future cash flows and expected technology life cycles. Intangible assets are amortized over their estimated useful life; the period over which the Company anticipates generating economic benefit from the asset. Fair value adjustments subsequent to the acquisition date, that are not measurement period adjustments, are recognized in earnings.

Goodwill

Goodwill represents the future economic benefits arising from other assets acquired in a business combination that is not individually identified and separately recorded. The excess of the purchase price over the estimated fair value of net assets of businesses acquired in a business combination is recognized as goodwill. Goodwill is not amortized but is tested for impairment at least annually (as of the first day of the fourth quarter) or as circumstances indicate the value may no longer be recoverable. To assess if goodwill is impaired, the Company performs a qualitative assessment to determine whether further impairment testing is necessary. The Company then compares the carrying amount of the single reporting unit to the fair value of the reporting unit. An excess carrying value over fair value would indicate that goodwill may be impaired. The Company performed a qualitative assessment during its annual impairment review for 2020 as of October 1, 2020 and concluded that it is more likely than not that the fair value of the Company’s single reporting unit is not less than its carrying amount. Therefore, the two-step goodwill impairment test for the reporting unit was not necessary in 2020.

Acquired Technology

Intangible assets consist of identifiable intangible assets, including developed technology, resulting from the Company’s acquisitions. The Company evaluates definite-lived intangible assets for impairment when events or changes in circumstances indicate that the carrying amount of such assets may not be recoverable. If indicators of impairment are present, the Company then compares the estimated undiscounted cash flows that the specific asset is expected to generate to its carrying value. If such assets are impaired, the impairment recognized is measured as the amount by which the carrying amount of the asset exceeds its fair value. To date, there have been no impairments of intangible assets. Intangible assets are amortized over their useful life.

Impairment of Long-Lived Assets

The Company evaluates whether events or circumstances have occurred that indicate that the estimated remaining useful life of its long-lived assets may warrant revision or that the carrying value of these assets may be impaired. The Company does not believe that any events have occurred through December 31, 2020, that would indicate its long-lived assets are impaired.

Research and Development

Research and development costs are expensed as incurred. Research and development expense includes costs, primarily related to salaries and benefits for employees, prototypes and design expenses, incurred to develop intellectual property and is charged to expense as incurred.

F-15

Table of Contents

DESKTOP METAL, INC.

NOTES TO CONSOLIDATED FINANCIAL STATEMENTS

Capitalized Software

Costs incurred internally in researching and developing a software product to be sold to customers are charged to expense until technological feasibility has been established for the product. Once technological feasibility is established, costs incurred during the application development phase are capitalized only when the Company believes it is probable the development will result in new or additional functionality, and such software costs are capitalized until the product is available for general release to customers. Judgment is required in determining when technological feasibility of a product is established. The Company has determined that technological feasibility for software products is reached after all high-risk development issues have been resolved through coding and testing. Generally, this occurs shortly before the products are released, such that there are no material costs to capitalize.

The Company capitalizes certain costs related to the development and implementation of cloud computing software. The types of costs capitalized during the application development phase include employee compensation, as well as consulting fees for third-party developers working on these projects. The capitalized costs are amortized on a straight-line basis over the estimated useful life of the asset, which is typically 3 years.

Advertising Expense

Advertising expense is included within sales and marketing expense in the consolidated statements of operations and was $0.04 million and $0.1 million for the years ended years ended December 31, 2020 and 2019, respectively. It primarily includes promotional expenditures and is expensed as incurred; as such, efforts have not met the direct-response criteria required for capitalization.

Stock-Based Compensation

The Company accounts for all stock options granted to employees and nonemployees using a fair value method. The fair value of options on the date of grant is calculated using the Black-Scholes option pricing model based on key assumptions such as stock price, expected volatility and expected term. The Company’s estimates of these assumptions are primarily based on the fair value of the Company’s stock, historical data, peer company data and judgment regarding future trends and factors.

In determining the exercise prices for options granted, the Company’s Board of Directors has considered the fair value of the common stock as of the measurement date. Prior to the Business Combination, the fair value of the common stock has been determined by the Board of Directors at each award grant date based upon a variety of factors, including the results obtained from an independent third-party valuation, the Company’s financial position and historical financial performance, the status of technological developments within the Company’s proposed products, an evaluation or benchmark of the Company’s competition, the current business climate in the marketplace, the illiquid nature of the common stock, arm’s length sales of the Company’s capital stock, including convertible preferred stock, the effect of the rights and preferences of the preferred shareholders, and the prospects of a liquidity event, among others.

Stock-based compensation is measured at the grant-date fair value of the award and is then recognized as the related services are rendered, typically over the vesting period. The Company estimates forfeitures that will occur in their determination of the expense recorded. The measurement date for employee awards is the date of grant, and stock-based compensation costs are recognized as expense over the employees' requisite service period, which is the vesting period, on a straight-line basis. Prior to the adoption of Accounting Standards Update (“ASU”) No. 2018-07, Compensation – Stock Compensation (Topic 718): Improvements to Nonemployee Share-Based Payment Accounting (“ASU No. 2018-07”), as discussed below under “Recently Adopted Accounting Guidance,” the measurement date for non-employee awards was generally the date the services were completed, resulting in financial reporting period adjustments to stock-based compensation during the vesting terms for changes in the fair value of the awards. After the adoption of ASU No. 2018-07, the measurement date for non-employee awards is the later of the adoption date of ASU No. 2018-07 or the date of grant, without changes in the fair value of the award. Stock-based compensation costs for non-employees are recognized as expense over the vesting period on a straight-line basis.

F-16

Table of Contents

DESKTOP METAL, INC.

NOTES TO CONSOLIDATED FINANCIAL STATEMENTS

Income Taxes

The Company recognizes deferred tax assets and liabilities for the expected future tax consequences of events that have been included in the Company’s consolidated financial statements and tax returns. Deferred tax assets and liabilities are determined based upon the differences between the consolidated financial statements carrying amounts and the tax bases of existing assets and liabilities and for loss and credit carryforwards, using enacted tax rates expected to be in effect in the years in which the differences are expected to reverse. Deferred tax assets are reduced by a valuation allowance if it is more likely than not that these assets may not be realized.

The Company provides reserves for potential payments of taxes to various tax authorities related to uncertain tax positions. Amounts recognized are based on a determination of whether a tax benefit taken by the Company in its tax filings or positions is “more likely than not” to be sustained on audit. The amount recognized is equal to the largest amount that is more than 50% likely to be sustained. Interest and penalties associated with uncertain tax positions are recorded as a component of income tax expense. As of December 31, 2020, and 2019, the Company has not identified any uncertain tax positions for which reserves would be required.

Comprehensive Loss

The Company’s comprehensive loss consists of its net loss and unrealized gain and loss from investments in debt securities.

Recently Issued Accounting Standards

Recently Adopted Accounting Guidance

In June 2018, the FASB issued ASU No. 2018-07 which substantially aligns the measurement and classification guidance for share-based payments to nonemployees with the guidance for share-based payments to employees. The ASU also clarifies that any share-based payment issued to a customer should be evaluated by the new revenue recognition standard. The new ASU requires a modified retrospective transition approach. The Company has adopted the ASU as of January 1, 2020, which did not have a material effect on the Company’s consolidated financial statements.

Recent Accounting Guidance Not Yet Adopted

In December 2019, the FASB issued ASU 2019-12, Income Taxes (Topic 740)—Simplifying the Accounting for Income Taxes, which simplifies the accounting for income taxes by eliminating some exceptions to the general approach in Accounting Standards Codification 740, Income Taxes. It also clarifies certain aspects of the existing guidance to promote more consistent application. This standard is effective for calendar-year public business entities in 2021 and interim periods within that year, and early adoption is permitted. The Company is currently in the process of evaluating the impact the new standard will have on the consolidated financial statements.

In January 2017, the FASB issued ASU No. 2017-04, Intangibles—Goodwill and Other (Topic 350): Simplifying the Test for Goodwill Impairment (“ASU 2017-04”), which eliminates the performance of Step 2 from the goodwill impairment test. In performing its annual or interim impairment testing, an entity will instead compare the fair value of the reporting unit with its carrying amount and recognize any impairment charge for the amount by which the carrying amount exceeds the reporting unit’s fair value. Additionally, an entity should consider income tax effects from any tax-deductible goodwill on the carrying amount of the reporting unit when measuring the goodwill impairment loss. As a smaller reporting company pursuant to Rule 12b-2 of the Securities Exchange Act of 1934, as amended, these changes become effective for the Company on January 1, 2023. The Company is currently evaluating the potential impact of these changes on the consolidated financial statements.

In June 2016, the FASB issued ASU 2016-13, Financial Instruments—Credit Losses. This ASU added a new impairment model (known as the current expected credit loss (“CECL”) model) that is based on expected losses rather than incurred losses. Under the new guidance, an entity recognizes as an allowance its estimate of expected credit losses. The CECL model applies to most debt instruments, trade receivables, lease receivables, financial guarantee contracts, and other loan commitments. The CECL model does not have a minimum threshold for recognition of impairment losses and entities will need to measure expected credit losses on assets

F-17

Table of Contents

DESKTOP METAL, INC.

NOTES TO CONSOLIDATED FINANCIAL STATEMENTS

that have a low risk of loss. As a smaller reporting company pursuant to Rule 12b-2 of the Securities Exchange Act of 1934, as amended, these changes become effective for the Company on January 1, 2023. The Company is currently evaluating the potential impact of these changes on the consolidated financial statements.

3. ACQUISITIONS

Business Combination

On December 9, 2020, the Company and Trine consummated the Business Combination, with Legacy Desktop Metal surviving the merger as a wholly-owned subsidiary of Trine. Upon the consummation of the Business Combination, each share of Legacy Desktop Metal capital stock issued and outstanding was converted into the right to receive 1.22122 shares (the “Exchange Ratio”) of the Company’s common stock (the “Per Share Merger Consideration”).

Upon the closing of the Business Combination, Trine’s certificate of incorporation was amended and restated to, among other things, increase the total number of authorized shares of all classes of capital stock to 550,000,000 shares, of which 500,000,000 shares were designated common stock; $0.0001 par value per share, and of which 50,000,000 shares were designated preferred stock, $0.0001 par value per share.

In connection with the execution of the definitive agreement for the Business Combination, Trine entered into separate subscription agreements (each, a “Subscription Agreement”) with a number of investors (each, a “Subscriber”), pursuant to which the Subscribers agreed to purchase, and Trine agreed to sell to the Subscribers, an aggregate of 27,497,500 shares of the Company’s Common Stock, for a purchase price of $10.00 per share and an aggregate purchase price of $275 million, in a private placement pursuant to the subscription agreements (the “PIPE financing”). The PIPE financing closed simultaneously with the consummation of the Business Combination.

The Business Combination is accounted for as a reverse recapitalization in accordance with GAAP. Under this method of accounting, Trine was treated as the “acquired” company for financial reporting purposes. See Note 1 “Organization and Nature of Business” for further details. Accordingly, for accounting purposes, the Business Combination was treated as the equivalent of Desktop Metal issuing stock for the net assets of Trine, accompanied by a recapitalization. The net assets of Trine are stated at historical cost, with no goodwill or other intangible assets recorded.

Prior to the Business Combination, Legacy Desktop Metal and Trine filed separate standalone federal, state and local income tax returns. As a result of the Business Combination, structured as a reverse recapitalization for tax purposes, Desktop Metal, Inc. (f/k/a Trine Acquisition Corp.), became the parent of the consolidated filing group, with Desktop Metal Operating, Inc. (f/k/a Desktop Metal, Inc.) as a subsidiary.

The following table reconciles the elements of the Business Combination to the consolidated statement of cash flows and the consolidated statement of changes in equity for the year ended December 31, 2020:

Recapitalization

Cash – Trine's trust and cash (net of redemptions)

$

305,084,695

Cash – PIPE financing


274,975,000

Less: transaction costs and advisory fees paid


(45,463,074)

Net proceeds from reverse recapitalization


534,596,621

Plus: non-cash net liabilities assumed


(2,649,804)

Less: accrued transaction costs and advisory fees


(1,900,793)

Net contributions from reverse recapitalization

$

530,046,024

F-18

Table of Contents

DESKTOP METAL, INC.

NOTES TO CONSOLIDATED FINANCIAL STATEMENTS

The number of shares of common stock issued immediately following the consummation of the Business Combination:

Number of Shares

Common stock, outstanding prior to Business Combination

30,015,000

Less: redemption of Trine shares


(26,049)

Common stock of Trine


29,988,951

Trine Founder Shares


5,552,812

Trine Director Shares


100,000

Shares issued in PIPE financing

27,497,500

Business Combination and PIPE financing shares

63,139,263

Legacy Desktop Metal shares (1)


161,487,334

Total shares of common stock immediately after Business Combination


224,626,597

(1) The number of Legacy Desktop Metal shares was determined from the shares of Legacy Desktop Metal shares outstanding immediately prior to the closing of the Business Combination converted at the Exchange Ratio of 1.22122. All fractional shares were rounded down.

In connection with the Business Combination, 7,403,750 Trine Founder Shares were issued. Pursuant to the Business Combination agreement, 75% of the Founder shares, or 5,552,812 shares, vested at the close of the Business Combination, with the remaining 25%, or 1,850,938 shares, vesting if the Company trades at $12.50 per share or higher for any 20 trading days within a 30-day window by the fifth anniversary of the Business Combination. As of December 31, 2020, 20 trading days had not yet passed since the date of the Business Combination, and the shares remained unvested and held in escrow. The vesting criteria was met on January 8, 2021.

2020 Acquisitions

In December 2020, the Company acquired all issued and outstanding membership interests of Figur Machine Tools, LLC (“Figur”) for a total purchase price of $3.5 million. Figur is engaged in research and development of 3D metal forming for sheet metal. The Company concluded the arrangement did not result in the acquisition of a business, as substantially all of the fair value of the gross assets acquired was concentrated in a single acquired technology asset and the Company did not obtain any substantive processes in connection with this acquisition. Therefore, the Company accounted for the arrangement as an asset acquisition. The fair value attributable to the acquired assets was $3.5 million, which was recorded as acquired technology in the Company’s consolidated balance sheet.

In October 2020, the Company acquired all outstanding shares of Forust Corporation (“Forust”) for a total purchase price of $2.5 million. The purchase price consisted of cash consideration of $2.0 million and $0.5 million of consideration relating to 61,061 shares of Common Stock. The Company paid $1.8 million at closing and will pay the additional $0.2 million within one year. Forust is engaged in research and development of 3D printing of wood products using sawdust in the process of additive manufacturing. The Company concluded the arrangement did not result in the acquisition of a business, as substantially all of the fair value of the gross assets acquired was concentrated in a single acquired technology asset and the Company did not obtain any substantive processes in connection with this acquisition. Therefore, the Company accounted for the arrangement as an asset acquisition. The fair value attributable to the acquired assets was $2.5 million, which was recorded as acquired technology in the Company’s consolidated balance sheet. In connection with the acquisition, the Company issued additional restricted stock units to employees and contractors of Forust which vest over a service period of two years and are accounted for as post-combination expense.

2019 Acquisitions

In July 2019, the Company acquired all outstanding shares of Make Composites, Inc. (“Make”) for a total purchase price of $5.4 million through the issuance of 873,203 shares of the Company’s Common Stock. Make is a composite printer research and development company that was acquired primarily for the complementary technology. The Company incurred transaction costs totaling $0.1 million that are included in general and administrative expenses in the consolidated statements of operations. The

F-19

Table of Contents

DESKTOP METAL, INC.

NOTES TO CONSOLIDATED FINANCIAL STATEMENTS

purchase price was allocated with $1.9 million to goodwill, $3.2 million to acquired technology, and $0.3 million to acquired tangible assets, consisting primarily of cash. The Company recorded a gain of $1.4 million on its original non-controlling investment of Make. This gain is recorded in interest and other income, net in the consolidated statements of operations. The goodwill acquired is deductible for income tax purposes. As of December 31, 2019, the Company’s accounting for the acquisition is complete. In connection with the acquisition, the Company issued restricted stock, options and warrants to employees and contractors of Make which have future service obligations to vest and are accounted for as post-combination expense.

In March 2019, the Company acquired all outstanding shares of addLEAP AB, a Swedish3D printer research and development company, for a purchase price of $0.4 million paid in cash. The acquisition was completed to further the Company’s advances in 3D printing. The purchase price was allocated to $0.3 million of goodwill and $0.1 million of acquired technology. Total transaction costs of $0.1 million are included in general and administrative expenses in the consolidated statements of operations. The goodwill acquired is deductible for income tax purposes. As of December 31, 2019, the Company’s accounting for the acquisition is complete. In connection with the acquisition, the Company issued 74,843 shares of restricted stock that have future service obligations to vest and are accounted for as post-combination expense.

4. CASH EQUIVALENTS AND SHORT-TERM INVESTMENTS

The Company’s cash equivalents and short-term investments are invested in the following (in thousands):

December 31, 2020


Amortized Cost


Unrealized Gains


Unrealized Losses


Fair Value

Commercial paper

$

75,374

$

$

$

75,374

Money market funds

407,512

407,512

Total cash equivalents

482,886

482,886

U.S Treasury securities

19,995

2

19,997

Commercial paper

43,911

43,911

Corporate bonds

47,970

(11)

47,959

Total short-term investments

111,876

2

(11)

111,867

Total cash equivalents and short-term investments

$

594,762

$

2

$

(11)

$

594,753

December 31, 2019


Amortized Cost


Unrealized Gains


Unrealized Losses


Fair Value

Repurchase agreements

$

25,001

$

$

$

25,001

Money market funds

40,454

40,454

Total cash equivalents

65,455

65,455

Asset‑backed securities

16,786

20

16,806

Commercial paper

19,938

19,938

Corporate bonds

47,955

55

48,010

Total short-term investments

84,679

75

84,754

Total cash equivalents and short-term investments

$

150,134

$

75

$

$

150,209

5. FAIR VALUE MEASUREMENTS

The Company uses the following three-tier fair value hierarchy, which prioritizes the inputs used in measuring the fair values for certain of its assets and liabilities:

Level 1 is based on observable inputs, such as quoted prices in active markets;

Level 2 is based on inputs other than the quoted prices in active markets that are observable either directly or indirectly; and

Level 3 is based on unobservable inputs in which there is little or no market data, which requires the Company to develop its own assumptions.

F-20

Table of Contents

DESKTOP METAL, INC.

NOTES TO CONSOLIDATED FINANCIAL STATEMENTS

This hierarchy requires the Company to use observable market data, when available, and to minimize the use of unobservable inputs when determining fair value. Items measured at fair value on a recurring basis include money market funds.

The following fair value hierarchy table presents information about the Company’s financial assets measured at fair value on a recurring basis and indicates the fair value hierarchy of the inputs the Company utilized to determine such fair value (in thousands):

December 31, 2020

Quoted Prices in

Significant

Active Markets

Other

Significant


for Identical

Observable

Unobservable


Items

Inputs

Inputs


(Level 1)


(Level 2)


(Level 3)


Total

Assets:

Money market funds

$

407,512

$

$

$

407,512

Commercial paper

119,285

119,285

Corporate bonds


47,959


47,959

U.S. Treasury securities

19,997

19,997

Other investments

3,000

3,000

Total assets

$

427,509

$

167,244

$

3,000

$

597,753

December 31, 2019

Quoted Prices in

Significant 

 Active Markets

Other

Significant

 for Identical

 Observable 

 Unobservable 

 Items

Inputs

Inputs


 (Level 1)


 (Level 2)


 (Level 3)


Total

Assets:


Money market funds

$

40,454

$

$

$

40,454

Commercial paper

19,938

19,938

Corporate bonds


48,010


48,010

Asset‑backed securities


16,806


16,806

Repurchase agreements


25,001


25,001

Total assets

$

40,454

$

109,755

$

$

150,209

The Company has determined that the estimated fair value of its repurchase agreements, corporate bonds, commercial paper, and asset-backed securities are reported as Level 2 financial assets as they are based on model-driven valuations in which all significant inputs are observable, or can be derived from or corroborated by observable market data for substantially the full term of the asset.

The other investment is reported as a Level 3 financial asset because the methodology used to develop the estimated fair value includes significant unobservable inputs reflecting management’s own assumptions, including the rights and obligations of the securities the Company holds as well as the probability of a qualified financing event, acquisition, or change in control.

There were no transfers between fair value measure levels during the years ended December 31, 2020 and 2019. The following table presents information about the Company’s movement in Level 3 assets measured at fair value (in thousands):

2020

2019

Balance at beginning of year

$

$

Additions

3,000

Balance at end of year

$

3,000

$

F-21

Table of Contents

DESKTOP METAL, INC.

NOTES TO CONSOLIDATED FINANCIAL STATEMENTS

6. ACCOUNTS RECEIVABLE

The components of accounts receivable are as follows (in thousands):

December 31, 

2020


2019

Trade receivables

$

7,016

$

4,722

Allowance for doubtful accounts

(500)

(199)

Total accounts receivable

$

6,516

$

4,523

The following table summarizes activity in the allowance for doubtful accounts (in thousands):

Years Ended December 31, 

2020

2019

Balance at beginning of year

$

199

$

Provision for uncollectible accounts

377

199

Uncollectible accounts written off

(76)

Balance at end of year

$

500

$

199

7. PREPAID EXPENSES AND OTHER CURRENT ASSETS

Prepaid expenses and other current assets consists of the following (in thousands):

December 31, 

2020


2019

Deferred cost of goods sold

$

454

$

262

Prepaid operating expenses

68

585

Prepaid dues and subscriptions

189

503

Prepaid insurance

121

45

Prepaid rent

118

11

Other

26

482

Total prepaid expenses and other current assets

$

976

$

1,888

8. PROPERTY AND EQUIPMENT

Property and equipment, net consists of the following (in thousands):

December 31, 


2020


2019

Equipment

$

13,708

$

13,358

Furniture and fixtures


895


895

Computer equipment


1,089


1,089

Tooling


1,805


1,823

Software


1,249


954

Leasehold improvements


13,870


13,880

Construction in process


879


170

Property and equipment, gross


33,495


32,169

Less: accumulated depreciation


(21,335)


(13,782)

Total property and equipment, net

$

12,160

$

18,387

F-22

Table of Contents

DESKTOP METAL, INC.

NOTES TO CONSOLIDATED FINANCIAL STATEMENTS

Depreciation and amortization expense was $7.6 million and $7.6 million for the years ended years ended December 31, 2020 and 2019, respectively.

9. ACQUIRED TECHNOLOGY

Acquired technology consisted of the following (in thousands):


Accumulated


Balance

Gross Value

Estimated Life

Amortization

December 31, 2020

Acquired technology

$

10,193

5 years

$

1,091

$

9,102

The Company recognized $0.8 million and $0.3 million of amortization expense as of December 31, 2020 and 2019, respectively, and expects to recognize $2.0 million of amortization expense annually in the years ended December 31, 2021 through 2023, $1.8 million in 2024, and $1.3 million in 2025. The weighted-average remaining amortization period is 4.6 years.

10. CAPITALIZED SOFTWARE

Capitalized software consists of the following (in thousands):

Years Ended December 31, 


2020


2019

Capitalized software development costs

$

1,127

$

1,127

Accumulated amortization


(815)


(237)

Impairment


(444)

Total capitalized software, net

$

312

$

446

The Company incurred $0.1 million and $0.2 million in amortization expense for the years ended December 31, 2020 and 2019, respectively, which is recorded in research and development operating expenses in the consolidated statements of operations. The Company recorded impairment charges of $0.0 million and $0.4 million in the years ended December 31, 2020 and 2019, for software that will no longer be utilized by the Company. The Company expects to incur amortization expense of $0.2 million, $0.1 million for the years ending 2021 2022, respectively and immaterial amortization expense for the year ending 2023.

11. OTHER NONCURRENT ASSETS

The following table summarizes the Company’s components of other noncurrent assets (in thousands):

December 31, 


2020


2019

Other investments

$

3,000

$

Right of use asset

1,810

2,289

Long-term deposits

69

Total other noncurrent assets

$

4,879

$

2,289

During the year ended December 31, 2020, the Company made an investment in a privately held company in the form of convertible debt for $3.0 million. Under the terms of this agreement, the debt will be converted to common stock of the investee upon the closing of a qualified financing, acquisition or change in control. The full principal balance plus 3% annual interest is due in two years and does not allow voluntary prepayment. As of December 31, 2020, the balance of other investments was $3.0 million. As of December 31, 2019, there were no other investments.

F-23

Table of Contents

DESKTOP METAL, INC.

NOTES TO CONSOLIDATED FINANCIAL STATEMENTS

12. ACCRUED EXPENSES AND OTHER CURRENT LIABILITIES

The following table summarizes the Company’s components of accrued expenses and other current liabilities (in thousands):

December 31, 


2020


2019

Professional services

$

2,508

$

780

Compensation and benefits related


2,068


897

Warranty reserve

1,553

1,491

Sales and use and franchise taxes

586

578

Franchise and royalty fees


159


Inventory purchases


86


620

Other


605


687

Total accrued expenses and other current liabilities

$

7,565

$

5,053

13. DEBT

Term Loan—In June 2018, the Company entered into a $20 million term loan for 36 months. The loan provided $10 million immediately funded with the additional $10 million available to be drawn in up to three draws of not less than $2 million for 12 months from close of the facility. The loan is interest-only for the full 36 months with the principal due at maturity in June 2021. Interest is calculated using the Wall Street Journal Prime rate (3.25% at December 31, 2020 and 4.75% at December 31, 2019) minus 0.5%, for a rate of 2.75% at December 31, 2020 and 4.25% at December 31, 2019, payable monthly in arrears. The loan contains a cash trigger. If the Company’s cash and investments fall below $30 million, cash equal to the total amount of the outstanding debt is required to be placed in a restricted money market account. The loan also contains reporting requirements and gives the lender first priority lien on all assets.

The outstanding amount as of December 31, 2020 and 2019 was $10.0 million in both periods. The $10.0 million is due in June 2021.

PPP Loan— In April 2020, the Company received loan proceeds in the amount of approximately $5.4 million under the Paycheck Protection Program (the “PPP”). The PPP, established as part of the Coronavirus Aid, Relief and Economic Security Act, provides for loans to qualifying businesses. The Company repaid the loan in its entirety on May 13, 2020.

Deferred Financing Costs—In connection with the above borrowings, the Company incurred $0.1 million of expenses, which have been recorded as deferred financing costs. The Company amortizes these costs over the life of the borrowing. During the years ended December 31, 2020 and 2019, the Company recorded immaterial interest expense related to the amortization of the financing costs. As of December 31, 2020, and 2019, the remaining unamortized balance of deferred financing costs is immaterial, and is included as a component of current portion of long-term debt, net of deferred financing costs in the consolidated balance sheets.

14. LEASES

At December 31, 2020, the Company recorded $1.8 million as a right of use asset and $3.0 million as an operating lease liability. At December 31, 2019, the Company recorded $2.3 million as a right of use asset and $3.8 million as an operating lease liability. The Company assesses its right of use asset and other lease-related assets for impairment. There were no impairments recorded related to these assets during the years ended December 31, 2020 and 2019.

The Company identified one service agreement that contained an embedded lease. The agreement does not contain fixed or minimum payments, but the Company has concluded that the variable lease expense was immaterial during the years ended December 31, 2020 and 2019, respectively.

F-24

Table of Contents

DESKTOP METAL, INC.

NOTES TO CONSOLIDATED FINANCIAL STATEMENTS

Information about other lease-related balances is as follows (in thousands):

Years Ended December 31, 


2020


2019


Lease cost


Operating lease cost

$

746

$

655

Short‑term lease cost


32

Variable lease cost


40


40

Total lease cost

$

786

$

727

Other Information


Operating cash flows from operating leases

$

1,073

$

951

Weighted‑average remaining lease term—operating leases (years)


3.2


4.2

Weighted‑average discount rate—operating leases


7.6

%  


7.6

%

The rate implicit in the lease is not readily determinable in most of the Company’s leases, and therefore the Company uses its incremental borrowing rate as the discount rate when measuring operating lease liabilities. The incremental borrowing rate represents an estimate of the interest rate the Company would incur at lease commencement to borrow an amount equal to the lease payments on a collateralized basis over the term of the lease.

Future minimum lease payments under noncancelable operating leases at December 31, 2020, are as follows (in thousands):

2021


$

1,071

2022


1,069

2023


1,028

2024


258

2025


Total lease payments


3,426

Less amount representing interest


(401)

Total lease liability


3,025

Less current portion of lease liability


(868)

Lease liability, net of current portion

$

2,157

As of December 31, 2020, the Company does not have material operating leases that have not commenced.

15. COMMITMENTS AND CONTINGENCIES

Legal Proceedings

From time to time, the Company may face legal claims or actions in the normal course of business. At each reporting date, the Company evaluates whether a potential loss amount or a potential range of loss is probable and reasonably estimable under the provisions of the authoritative guidance that addresses accounting for contingencies. The Company expenses as incurred the costs related to its legal proceedings.

The Company was engaged in arbitration with Markforged, Inc., a competitor in the 3D printing industry, regarding claims against the Company alleging false and misleading statements about Markforged, Inc’s products in violation of a settlement agreement that the Company entered into with Markforged, Inc. to settle a prior dispute regarding patent infringement and trade secret misappropriation. The hearing was held in December 2020 and the arbitrator has ruled that that the Company does not owe Markforged any damages in association with the claim.

Manufacturing Commitments

F-25

Table of Contents

DESKTOP METAL, INC.

NOTES TO CONSOLIDATED FINANCIAL STATEMENTS

As of December 31, 2020, the Company had outstanding purchase orders with contract manufacturers in the amount of $9.5 million.

16. INCOME TAXES

During the years ended December 31, 2020 and 2019, the Company recorded ($940) and $0 of income tax benefit which was primarily driven by a partial valuation allowance release. For financial reporting purposes, Loss before provision for income taxes, includes the following components (in thousands):

Years Ended December 31, 


2020


2019

United States

$

(90,702)

$

(103,596)

Foreign


(670)


Loss before income taxes

$

(91,372)

$

(103,596)

The provision (benefit) for income taxes consists of the following (in thousands):

Years Ended December 31, 

2020


2019

Current

$

$

Deferred

(940)

Provision (benefit) for income taxes

$

(940)

$

A reconciliation of the expected income tax (benefit) computed using the federal statutory income tax rate to the Company’s effective income tax rate for the years ended December 31, 2020 and 2019 is as follows:

Years Ended December 31, 


2020


2019


Effective income tax rate:

Expected income tax benefit at the federal statutory rate


21

%


21

%

State taxes

6

%

6

%

Change in valuation allowance

(26)

%

(30)

%

Research and development credit carryover

2

%

2

%

Permanent differences

(2)

%

1

%

Effective income tax rate

1

%

%

F-26

Table of Contents

DESKTOP METAL, INC.

NOTES TO CONSOLIDATED FINANCIAL STATEMENTS

As of December 31, 2020, and 2019, deferred tax assets consist of the following (in thousands):

Years Ended December 31, 


2020


2019

Deferred tax assets:

Federal and state net operating carryforwards

$

77,463

$

56,333

Research and development and other credits

13,555

11,072

Capitalized start‑up costs

15,717

17,032

Compensation‑related items

2,257

1,286

Deferred lease liability

872

1,111

Depreciation

1,503

Other deferred tax assets

2,272

2,068

Total gross deferred tax asset

113,639

88,902

Valuation allowance

(111,494)

(87,370)

Net deferred tax asset

2,145

1,532

Deferred tax liabilities:

Right‑of‑use asset

(522)

(664)

Acquired technology

(1,623)

(868)

Total deferred tax liabilities

(2,145)

(1,532)

Net deferred tax asset

$

$

Realization of deferred tax assets is dependent upon the generation of future taxable income. As required by ASC 740 Income Taxes, the Company evaluated the positive and negative evidence bearing upon its ability to realize the deferred tax assets as of December 31, 2020. As a result of the fact that the Company has incurred tax losses from inception, the Company has determined that it was more likely than not that the Company would not realize the benefits of federal and state net deferred tax assets. As a result of a recent acquisition, the Company recorded a U.S. deferred tax liability related to a non-tax-deductible intangible asset recognized in the financial statements. The acquired deferred tax liability is a source of income to support recognition of Company’s existing deferred tax assets. Pursuant to ASC 805, the impact on a Company’s existing deferred tax assets and liabilities caused by an acquisition should be recorded in the financial statements outside of acquisition accounting. Accordingly, the Company recorded a $0.9 million income tax benefit for the release in the valuation allowance related to the acquired intangible. The U.S maintains a valuation allowance on the overall U.S. net deferred tax asset as it is deemed more likely than not the U.S. net deferred tax asset will not be realized. Accordingly, a full valuation allowance was established against the net deferred tax assets as of December 31, 2020 and 2019.

Changes in the valuation allowance for deferred tax assets during the years ended December 31, 2020 and 2019 were as follows (in thousands):

Years Ended December 31, 


2020


2019

Valuation allowance at beginning of the year

$

87,370

$

56,405

Increases recorded to income tax provision


25,058


30,965

Decreases recorded as a benefit to income tax provision

(934)

Valuation allowance at end of year

$

111,494

$

87,370

As of December 31, 2020, and 2019, the Company had federal net operating loss carryforwards of $273.8 million and $197.7 million, respectively, which may be available to reduce future taxable income. These carryforwards generated in 2017 and prior expire at various dates through 2037. The $228.3 million in carryforwards generated from 2018 forward do not expire. As of December 31, 2020, and 2019, the Company had State net operating loss carryforwards of $243.2 million and $184.2 million, respectively, which may be available to reduce future taxable income. These carryforwards expire at various dates through 2040. In addition, the Company had federal and state research and development tax credit carryforwards of $13.5 million available to reduce future tax liabilities, which will expire at various dates through 2040.

F-27

Table of Contents

DESKTOP METAL, INC.

NOTES TO CONSOLIDATED FINANCIAL STATEMENTS

Utilization of the Company’s net operating loss (“NOL”) carryforwards and research and development (“R&D”) credit carryforwards may be subject to a substantial annual limitation due to ownership change limitations that have occurred previously or that could occur in the future in accordance with Section 382 of the Internal Revenue Code of 1986 (“Section 382”) as well as similar state provisions. These ownership changes may limit the amount of NOL and R&D credit carryforwards that can be utilized annually to offset future taxable income and taxes, respectively. In general, an ownership change as defined by Section 382 results from transactions increasing the ownership of certain shareholders or public groups in the stock of a corporation by more than 50% over a three-year period. The Company has not conducted a study to assess whether a change of control has occurred or whether there have been multiple changes of control since inception due to significant complexity with such a study. If the Company has experienced a change of control, as defined by Section 382, at any time since inception, utilization of the net operating loss carryforward or research and development tax credits carryforwards would be subject to an annual limitation under Section 382. Although the Company has not completed its analysis, it is reasonably possible that its federal NOLs available to offset future taxable income could materially decrease. This reduction would be offset by an equal and offsetting adjustment to the existing valuation allowance. Given the offsetting adjustments to the existing valuation allowance, any ownership change is not expected to have an adverse material effect on the Company’s consolidated financial statements. Any limitation may result in expiration of a portion of the net operating loss carryforward or research and development tax credit carryforwards before utilization.

The Company files income tax returns in the U.S. federal tax jurisdiction, Massachusetts and Rhode Island. Since the Company is in a loss carryforward position, the Company is generally subject to examination by the U.S. federal, state and local income tax authorities for all tax years in which a loss carryforward is available. The Company is currently not under examination by the Internal Revenue Service of any other jurisdiction for any tax years. The Company has not recorded any interest or penalties on any unrecognized tax benefits since inception. The Company does not believe material uncertain tax positions have arisen to date.

17. STOCKHOLDERS’ EQUITY

As of December 31, 2020, the Company’s authorized shares consisted of 500,000,000 shares of Class A Common Stock, $0.0001 par value (the “Common Stock”) and 50,000,000 shares of Preferred Stock, $0.0001 par value (the “Preferred Stock”).

Common Stock

Restricted Stock Agreements—During 2015, the Company issued 34,010,977 shares of Common Stock to the initial founders and certain employees of the Company at a purchase price of $0.0001 per share. These shares are fully vested.

During the year ended December 31, 2019, as part of the Company’s acquisitions, the Company issued 607,300 shares of restricted stock with a value of $2.0 million which are considered post-combination consideration and accounted for as stock-based compensation as the shares vest. The shares vest over a four-year service period.

The activity for stock subject to vesting for years ended December 31, 2020 and 2019, are as follows (shares in thousands):

Shares subject 


Weighted Average


to Vesting


 Purchase Price

Balance of unvested shares as of January 1, 2020

5,587

$0.0001

Issuance of additional shares


Vested


(5,307)


$0.001

Balance of unvested shares as of December 31, 2020


280


$0.001

At December 31, 2020, the remaining weighted-average vesting period for the stock subject to vesting was 0.6 years.

Promissory Note Shares

In March 2018, the Company issued a promissory note totaling $0.2 million in exchange for 340,923 shares of Common Stock. The note accrued interest at the rate of 2.57% per annum and was fully collateralized by the assets of the holder. The Company has

F-28

Table of Contents

DESKTOP METAL, INC.

NOTES TO CONSOLIDATED FINANCIAL STATEMENTS

accounted for the note as recourse note and has recorded it as a deduction from stockholders’ equity. The note plus immaterial interest was settled with the Company through the repurchase of 76,461 shares of Common Stock by the Company, at the then current fair value in March 2019.

Common Stock Warrants

In May 2017, the Company entered into a strategic collaboration agreement with an investor allowing the investor’s resellers to sell and distribute the Company’s products. In consideration for this agreement, the Company agreed to issue warrants to purchase up to 2,442,440 shares of Common Stock. The investor was eligible to receive a warrant to purchase one share of Common Stock for every $35.00 in revenue generated by the Company from the investor’s resellers. Each warrant was issued at an exercise price equal to $3.34 per share (subject to appropriate adjustment in the event of a stock dividend, stock split, combination, or other similar recapitalization) and was set to expire on December 31, 2027. The Company issued 122,073 warrants in 2020 and 611,969 warrants in 2019. The Company recorded $0.2 million related to the fair value of the warrants in 2020 and $1.0 million in 2019, calculated using the Black-Scholes warrant-pricing model with the following assumptions:

Years Ended December 31, 


2020


2019


Risk‑free interest rate

2.0

%

2.0

%

Expected volatility

52.5

%

52.5

%

Expected life (in years)

8.0

8.08.8

Expected dividend yield

Fair value of Common Stock

$

3.34

$

3.34

756,498 warrants were converted to 447,938 shares of Common Stock through a cashless exercise in connection with the Business Combination.

In August 2020, the Company issued a warrant to purchase up to 366,366 shares of common stock, par value $0.0001, in exchange for technical research and development advisor services. Each warrant was issued at an exercise price of $3.34 per share (subject to appropriate adjustment in the event of a stock dividend, stock split, combination, or other similar recapitalization) and was set to expire on August 22, 2027. The Company recorded $1.7 million related to the fair value of the warrants in 2020, calculated using the Black-Scholes warrant-pricing model with the following assumptions:

Year Ended December 31, 

2020


Risk‑free interest rate

0.5

%

Expected volatility

52.5

%

Expected life (in years)

0.3

Expected dividend yield

Fair value of Common Stock

$

7.98

366,366 warrants vested upon a change in control and were converted to 244,428 shares of Common Stock through a cashless exercise in connection with the Business Combination.

Trine Warrants

In Trine’s initial public offering, it sold units at a price of $10.00 per unit, which consisted of one share of Common Stock, $0.0001 par value, and one-half of a redeemable warrant (each, a “Public Warrant”). Each whole Public Warrant entitles the holder to purchase one share of Common Stock at a price of $11.50 per share and became exercisable as of 30 days from the date of the Business Combination. Unless earlier redeemed, the Public Warrants will expire five years from the completion of the Business Combination. The Company may redeem the outstanding Public Warrants in whole and not in part at a price of $0.01 per Public Warrant upon a minimum of 30 days’ prior written notice of redemption, and only in the event that the last sale price of the

F-29

Table of Contents

DESKTOP METAL, INC.

NOTES TO CONSOLIDATED FINANCIAL STATEMENTS

Company’s Common Stock is at least $18.00 per share for any 20 trading days within a 30-trading day period ending on the third trading day prior to the date on which notice of redemption is given. If the Company redeems the Public Warrants as described above, it will have the option to require all Public Warrant holders that wish to exercise to do so on a “cashless basis”. As of December 31, 2020, 20 trading days had not yet passed since the date of the Business Combination, and the Company did not yet have the right to redeem the outstanding Public Warrants. As of December 31, 2020, there were 15,007,494 million outstanding Public Warrants.

The Warrant Agreement, dated as of March 14, 2019, by and between the Company and Continental Stock Transfer & Trust Company also obligated the Company to use its best efforts to file with the SEC a registration statement for the registration, under the Securities Act of 1933, as amended (the “Securities Act”), of the issuance of the shares of Common Stock issuable upon exercise of the Public Warrants, and to cause the same to become effective and remain effective while the Public Warrants remain outstanding. On February 4, 2021, the Company’s registration statement covering such shares became effective.

Simultaneously with the consummation of Trine’s initial public offering, Trine Sponsor IH, LLC (the “Sponsor”) purchased an aggregate of 8,503,000 warrants to purchase one share of Common Stock at an exercise price of $11.50 (the “Private Placement Warrants”) at a price of $1.00 per warrant ($8,503,000) in the aggregate in a private placement.

The Private Placement Warrants are identical to the Public Warrants except that the Private Placement Warrants are not redeemable by Desktop Metal, and may be exercised for cash or on a cashless basis so long as they are held by the Sponsor or any of its permitted transferees. Additionally, pursuant to the terms of the amended and restated registration rights agreement entered in connection with the Business Combination, the Sponsor had the right to have the resale of the shares of Common Stock acquired upon exercise of the Private Placement Warrants registered under the Securities Act. On February 4, 2021, the Company’s registration statement covering such shares became effective.

On February 24, 2020, Trine issued an unsecured promissory note (the “2020 Note”) to the Sponsor. The 2020 Note bore no interest and was repayable in full upon consummation of the Business Combination. The Sponsor had the option to convert any unpaid balance of the 2020 Note into warrants equal to the principal amount of the 2020 Note so converted divided by $1.00. Upon closing of the Business Combination, the 2020 Note was converted into a Private Placement Warrant for 1,500,000 shares of Common Stock, with an exercise price of $0.0001. The terms of these warrants are identical to the terms of the private placement warrants. Pursuant to the terms of the amended and restated registration rights agreement entered in connection with the Business Combination, the Sponsor had the right to have the resale of the shares of Common Stock acquired upon exercise of such warrant registered under the Securities Act. On February 4, 2021, the Company’s registration statement covering such shares became effective.

Legacy Desktop Metal Convertible Preferred Stock

In connection with the Business Combination, Legacy Desktop Metal’s Convertible Preferred Stock (“Legacy Convertible Preferred Stock”) previously classified as mezzanine was retroactively adjusted, converted into Common Stock, and reclassified to permanent equity as a result of the reverse recapitalization. As of December 31, 2020, there is no Legacy Convertible Preferred Stock authorized, issued or outstanding. The following table summarizes details of Legacy Convertible Preferred Stock authorized, issued and outstanding immediately prior to the Business Combination ($ in thousands):

F-30

Table of Contents

DESKTOP METAL, INC.

NOTES TO CONSOLIDATED FINANCIAL STATEMENTS


Prior to Business Combination

Legacy Convertible Preferred Stock Classes

Shares Authorized, Issued and Outstanding

Preferred Stock

Series A Legacy Convertible Preferred Stock, $0.0001 par value

26,189,545

$

13,878

Series B Legacy Convertible Preferred Stock, $0.0001 par value


23,675,035

37,806

Series C Legacy Convertible Preferred Stock, $0.0001 par value


13,152,896

44,852

Series D Legacy Convertible Preferred Stock, $0.0001 par value


21,075,193

180,353

Series E Legacy Convertible Preferred Stock, $0.0001 par value


13,450,703

134,667

Series E‑1 Legacy Convertible Preferred Stock, $0.0001 par value


2,494,737

24,977

Total

100,038,109

$

436,533

The following describes the rights and preferences of the Company’s Legacy Convertible Preferred Stock prior to conversion to common stock in the Business Combination:

Voting—The holders of Legacy Convertible Preferred Stock voted together with all other classes and series of stock as a single class on an as-converted basis. Each share of Legacy Convertible Preferred Stock entitled the holder to such number of votes per share as equaled the whole number of shares of Legacy Desktop Metal common stock into which such share of Legacy Convertible Preferred Stock was convertible. The holders of the Series A Legacy Convertible Preferred Stock were entitled to elect one director to the Company’s board of directors, the holders of the Series B Legacy Convertible Preferred Stock were entitled to elect two directors to the Company’s board of directors, the holders of the Series C Legacy Convertible Preferred Stock were entitled to elect one director to the Company’s board of directors, and the holders of the Series E Legacy Convertible Preferred Stock were entitled to elect one director to the Company’s board of directors. The holders of Legacy Convertible Preferred Stock retained rights to vote on certain specified matters as set forth in the Company’s certificate of incorporation. The holders of Series E-1 Legacy Convertible Preferred Stock were not entitled to vote in elections of directors.

Dividends—The holders of Legacy Convertible Preferred Stock were entitled to receive dividends at the rate of 8% of the original issue price for each series of Legacy Convertible Preferred Stock payable only when, as and if, declared by the Company’s board of directors. Through the date of the Business Combination, no dividends had been declared.

Liquidation—Upon any liquidation, dissolution, or winding-up of the Company, whether voluntary or involuntary, the holders of the Legacy Convertible Preferred Stock were entitled to first be paid out of assets available for distribution, on a pari passu basis, prior and in preference to any distribution to the holders of Legacy Desktop Metal common stock, the greater of (a) an amount equal to $0.53372 per share for the Series A Legacy Convertible Preferred Stock, $1.6013 per share for Series B Legacy Convertible Preferred Stock, $3.4213 per share for the Series C Legacy Convertible Preferred Stock, $8.5656 per share for the Series D Legacy Convertible Preferred Stock, and $10.0211 per share for the Series E and Series E-1 Legacy Convertible Preferred Stock, plus declared but unpaid dividends and (b) an amount per share that would have been payable had all shares of the applicable series of Legacy Convertible Preferred Stock been converted to shares of Legacy Desktop Metal common stock immediately prior to any liquidation, dissolution, or winding-up of the Company. After payment of all preferential amounts required to be paid to the holders of Legacy Convertible Preferred Stock, the remaining assets of the Company available for distribution to the stockholders were to be distributed among the holders of shares of Legacy Desktop Metal common stock pro rata based on the number of shares held by each such holder.

Conversion—Each holder of Legacy Convertible Preferred Stock had the right, at their option at any time, to convert any such shares of Legacy Convertible Preferred Stock into fully paid and nonassessable shares of Legacy Desktop Metal common stock. The conversion ratio was determined by dividing the original issue price of such share of Legacy Convertible Preferred Stock by the conversion price then in effect, which was equal to $0.53372 per share for the Series A Legacy Convertible Preferred Stock, $1.6013 per share for Series B Legacy Convertible Preferred Stock, $3.4213 per share for the Series C Legacy Convertible Preferred Stock, $8.5656 per share for the Series D Legacy Convertible Preferred Stock, and $10.0211 per share for the Series E and Series E-1 Legacy Convertible Preferred Stock. The conversion price was subject to adjustment if certain dilutive events occurred. Conversion was mandatory in the event of a firm-commitment underwritten initial public offering of the Company’s Legacy Desktop Metal common

F-31

Table of Contents

DESKTOP METAL, INC.

NOTES TO CONSOLIDATED FINANCIAL STATEMENTS

stock with a value of at least $5.13 per common share and $50 million in proceeds to the Company or upon the election of a majority of the holders of Legacy Convertible Preferred Stock, voting as a single class on an as-converted basis.

Redemption—The Legacy Convertible Preferred Stock was not subject to mandatory or optional redemption other than in connection with a liquidation, dissolution, or winding-up of the Company.

18. STOCK BASED COMPENSATION

Stock Incentive Plan—In 2015, the Board of Directors approved the adoption of the 2015 stock incentive plan (the “2015 Plan”). The 2015 Plan allowed for the award of incentive and nonqualified stock options, restricted stock, and other stock-based awards to employees, officers, directors, consultants, and advisers of the Company. Awards could be made under the 2015 Plan for up to 26,283,789 shares of Common Stock. Option awards expire 10 years from the grant date and generally vest over four years; however, vesting conditions can vary at the discretion of our Board of Directors.

As part of the acquisition of Make in 2019, the Company assumed the 2018 equity incentive plan of Make Composites, Inc. (the “Make Plan”). The Make Plan allows for the award of incentive and nonqualified stock options and warrants for those employees and contractors that were hired as part of the acquisition. The Make Plan allowed for 232,304 options and warrants to be issued, which were issued in 2019, with no additional options to be issued in the future. Option awards expire 10 years from the grant date and generally vest over four years; however, vesting conditions can vary at the discretion of our Board of Directors.

In December 2020, the Board of Directors and stockholders of the Company approved the adoption of the 2020 Incentive Award Plan (the “2020 Plan” and together with the 2015 Plan and the Make Plan, the “Plans”), which became effective on the date of the Business Combination. Upon effectiveness of the 2020 Plan, the company ceased granting new awards under the 2015 Plan.

The 2020 Plan allows for the award of incentive and nonqualified stock options, restricted stock, and other stock-based awards to employees, officers, directors, consultants, and advisers of the Company. The number of shares of common stock initially available for issuance under the 2020 Plan was 12,400,813 shares of common stock plus the number of shares subject to awards outstanding under the 2015 Plan that expire, lapse, terminate, or are exchanged for cash, surrendered, repurchased, or canceled without having been fully exercised or forfeited. In addition, the number of shares of common stock available for issuance under the 2020 Plan is subject to an annual increase on the first day of each calendar year beginning on January 1, 2021 and ending on and including January 1, 2030 equal to the lesser of (i) 5% of the aggregate number of shares of common stock outstanding on the final day of the immediately preceding calendar year and (ii) such smaller number of shares as is determined by the Board.

The Company grants stock options at exercise prices deemed by the Board of Directors to be equal to the fair value of the Common Stock at the time of grant. The fair value of Common Stock has been determined by the Board of Directors of the Company at each stock option measurement date based on a variety of different factors, including the results obtained from independent third-party appraisals, the Company’s consolidated financial position and historical financial performance, the status of technological development within the Company, the composition and ability of the current engineering and management team, an evaluation and benchmark of the Company’s competition, the current climate in the marketplace, the illiquid nature of the Common Stock, arm’s-length sales of the Company’s capital stock, and the prospects of a liquidity event, among others.

In July 2020 in order to incentivize and retain personnel, the Company repriced certain employee unvested stock options held by employees to have an exercise price equal to the most recent 409A private stock valuation. Vested awards were not eligible for repricing. Employees were allowed to opt out of the repricing of unvested stock option grants by providing notice to the Company within a month following the repricing. If an employee did not opt out of the repricing, all unvested options held by such employee were repriced and subject to a new vesting schedule. Repriced options vest over a period of four years from the date of the repricing, with one-year cliff vesting and monthly vesting thereafter. The repricing affected 116 employees, at an incremental compensation cost of $3.6 million to the Company, which will be recognized over the vesting period.

F-32

Table of Contents

DESKTOP METAL, INC.

NOTES TO CONSOLIDATED FINANCIAL STATEMENTS

During years ended December 31, 2020 and 2019, the Company granted options to purchase 8,450,799 shares and 5,730,586 shares of Common Stock to employees with a fair value of $29.8 million and $10.1 million, respectively, calculated using the Black-Scholes option-pricing model with the following assumptions:

Years Ended December 31, 


2020


2019


Risk‑free interest rate

0.3% – 1.7%

%

1.7% – 2.6

%

Expected volatility


52.7% – 54.2

%

52.7% – 53.6

%

Expected life (in years)


5.96.3


5.66.1

Expected dividend yield


Fair value of Common Stock

$

1.407.98


$

3.34

During the years ended December 31, 2020, and 2019, the Company granted options to purchase 12,212 shares and 119,581 shares of Common Stock to consultants with a fair value of $0.1 million and $0.6 million, respectively, calculated using the Black-Scholes option-pricing model with the following assumptions:

Years Ended December 31, 


2020


2019

Risk‑free interest rate

0.6% – 0.8

%

1.4% – 3.1

%

Expected volatility


54.3% – 54.8

%


52.4% – 61.5

%

Expected life (in years)


9.410.0


6.210.0

Expected dividend yield


Fair value of Common Stock

$

1.407.98

$

3.34

The risk-free interest rate assumption is based upon observed interest rates appropriate for the term of the related stock options. The expected life of stock options was calculated using the average of the contractual term of the option and the weighted-average vesting period of the option, as the Company does not have sufficient history to use an alternative method to the simplified method to calculate an expected life for employees. The Company has not paid a dividend and is not expected to pay a dividend in the foreseeable future. Expected volatility for the Common Stock was determined based on an average of the historical volatility of a peer group of similar public companies.

At December 31, 2020 and 2019, the total unrecognized stock-based compensation expense related to unvested stock options aggregated $13.7 million and $13.0 million, respectively. The costs are expected to be recognized over a weighted-average period of 2.8 years.

Total stock-based compensation expense related to all of the Company’s stock-based awards granted is reported in the consolidated statements of operations as follows (in thousands):

Years Ended December 31, 


2020


2019

Research and development

$

3,276

$

2,713

General and administrative expense


3,464


941

Sales and marketing expense


894


1,373

Cost of sales


372


188

Total stock-based compensation expenses

$

8,006

$

5,215

F-33

Table of Contents

DESKTOP METAL, INC.

NOTES TO CONSOLIDATED FINANCIAL STATEMENTS

There were 14,379,052 shares available for award under the 2020 Plan at December 31, 2020. The option activity of the 2015 Plan and Make Plan for the year ended December 31, 2020, is as follows (shares in thousands):


Weighted-Average 


Weighted-Average 

Remaining 


Aggregate

Number of 

Exercise Price 

Contractual Term 


Intrinsic Value


Shares


per Share


(in years)


(in thousands)

Outstanding at January 1, 2020

18,072

$

2.01

7.84

$

24,045

Granted


8,463

$

1.51


Exercised


(522)

$

0.62


Forfeited/expired


(6,460)

$

2.92


Outstanding at December 31, 2020


19,553

$

1.53


7.75

$

306,408

Options vested at December 31, 2020


10,905

$

1.53


6.52

$

170,868

Options vested or expected to vest at December 31, 2020


18,818

$

1.53


7.69

$

294,824

The weighted-average grant-date fair value for options granted during 2020 and 2019 was approximately $3.52 and $1.78, respectively. The aggregate intrinsic value of options exercised during the years ended December 31, 2020 and 2019, was $1.8 million and $3.4 million, respectively.

On September 28, 2020 the Company modified the vesting conditions for certain awards granted to one of our officers such that in the event of a change in control, half of the outstanding unvested options would vest. Upon the Business Combination, the total incremental compensation expense resulting from the modification was approximately $1.8 million.

Restricted Stock Units—RSUs awarded to employees and non-employees generally vest over four years from the anniversary date of the grant, with 1-year cliff vesting and monthly vesting thereafter, provided service with the Company is not terminated. The fair value of RSUs is equal to the estimated fair market value of the Company’s Common Stock on the date of grant. Total unrecognized compensation costs related to unvested RSUs at December 31, 2020 was approximately $4.8 million and is expected to be recognized over a period of 3.3 years. The total expense recognized during the year ended December 31, 2020 was $0.6 million.

RSU activity under the 2020 Plan for the year ended December 31, 2020 is as follows (shares in thousands):

Shares subject 


Weighted Average


to Vesting


Grant Date Fair Value

Balance of unvested shares as of January 1, 2020

Granted

683

$ 8.02

Vested

Balance of unvested shares as of December 31, 2020

683

$ 8.02

19. SEGMENT INFORMATION

In its operation of the business, management, including the Company’s chief operating decision maker, who is also Chief Executive Officer, reviews the business as one segment. The Company currently ships its product to markets in the Americas, Europe Middle East and Africa (“EMEA”), and Asia Pacific (“APAC”). Disaggregated revenue data for those markets is as follows (in thousands):

Revenue during the year ended December 31, 2020


Americas


EMEA


APAC


Total

Product

$

5,250

$

6,629

$

1,839

$

13,718

Services


1,415


1,159


178


2,752

Total

$

6,665

$

7,788

$

2,017

$

16,470

F-34

Table of Contents

DESKTOP METAL, INC.

NOTES TO CONSOLIDATED FINANCIAL STATEMENTS

Revenue during the year ended December 31, 2019


Americas


EMEA


APAC


Total

Product

$

12,746

$

8,430

$

1,582

$

22,758

Services


3,055


563


63


3,681

Total

$

15,801

$

8,993

$

1,645

$

26,439

During the years ended December 31, 2020 and 2019, the Company recognized the following revenue from service contracts and cloud-based software licenses over time, and hardware and consumable product shipments and subscription software at a point in time (in thousands):

Years Ended

December 31, 


2020


2019

Revenue recognized at a point in time

$

13,718

$

22,758

Revenue recognized over time


2,752


3,681

Total

$

16,470

$

26,439

The Company’s long-lived assets are substantially all located in the United States where the Company’s primary operations are located.

20. NET LOSS PER SHARE

The Company computes basic loss per share using net loss attributable to Common Stockholders and the weighted-average number of Common Stock shares outstanding during each period. Diluted earnings per share include shares issuable upon exercise of outstanding stock options and stock-based awards where the conversion of such instruments would be dilutive.

Years Ended December 31, 

(in thousands, except per share amounts)


2020


2019

Numerator for basic and diluted net loss per share:


Net loss attributable to Common Stockholders

$

(90,432)

$

(103,596)

Denominator for basic and diluted net loss per share:


Weighted average shares


157,906


150,002

Net loss per share—Basic and Diluted

$

(0.57)

$

(0.69)

The Company’s potential dilutive securities, which include outstanding Common Stock options, unvested restricted stock units, unvested restricted stock awards, outstanding Common Stock warrants, and Trine Founder Shares held in escrow, have been excluded from the computation of diluted net loss per share as the effect would be to reduce the net loss per share. Therefore, the weighted average number of common shares outstanding used to calculate both basic and diluted net loss per share attributable to common stockholders is the same. The Company excluded the following potential common shares, presented based on amounts outstanding as of December 31, 2020 and 2019, from the computation of diluted net loss per share attributable to common stockholders because including them would have an anti-dilutive effect (in thousands):

Years Ended December 31, 

2020


2019

Common Stock options outstanding

19,553

18,072

Unvested restricted stock units outstanding

683

Unvested restricted stock awards outstanding

279

5,587

Common Stock warrants outstanding

25,010

634

Unvested Trine Founder Shares, held in escrow

1,851

Total shares

47,376

24,293

F-35

Table of Contents

DESKTOP METAL, INC.

NOTES TO CONSOLIDATED FINANCIAL STATEMENTS

21. SUBSEQUENT EVENTS

On February 16, 2021, the Company acquired EnvisionTEC US, LLC and certain of its affiliates (“EnvisionTEC”) pursuant to a Purchase Agreement and Plan of Merger dated as of January 15, 2021. The Company expects this acquisition to create a comprehensive portfolio across metals, polymers and composites and grow distribution channels both in quantity and through the addition of a vertically-focused channel. The Company paid consideration of $143.8 million in cash and issued 5,036,142 shares of the Company’s Common Stock with a fair value of $159.8 million as of the close of business on the transaction date. In connection with the transaction, the Company also agreed to grant restricted stock units totaling 475,848 shares of the Company’s Common Stock to key EnvisionTEC employees. The acquisition will be accounted for as a business combination using the acquisition method of accounting. The Company is currently finalizing the allocation of the purchase price and expects the purchase price to be allocated primarily to goodwill and intangible assets.

On February 26, 2021, the Company delivered a notice to redeem all of its outstanding Public Warrants that remain unexercised at 5:00 p.m. New York City time on March 29, 2021. From January 1, 2021 through March 10, 2021, Public Warrants for 11,898,122 shares of Common Stock were exercised for cash, resulting in the Company receiving net proceeds of $136.8 million. An aggregate of 11,898,122 shares of the Company’s Common Stock were issued in connection with these exercises.

From January 1, 2021 through March 10, 2021, 8,503,000 Private Placement Warrants were exercised on a cashless basis. An aggregate of 5,850,386 shares of the Company’s Common Stock were issued in connection with these exercises.

Management has evaluated subsequent events occurring through March 15, 2021, the date that these consolidated financial statements were issued and determined that no additional subsequent events occurred that would require recognition or disclosure in these consolidated financial statements other than those in this note.

F-36